
Capital Gains Tax Scenarios and Analyses
Executive Summary
 This analysis explores a proposed capital gains tax structure-15% flat rate for foreign/non-qualifying gains and tiered rates for U.S. domestic stocks (7.5% for 1-3 years, 5% for 3-5 years, 2.5% for 5-10 years, 0% for 10+ years, with no NIIT)-evaluated under diverse economic scenarios tied to Trump’s tariff policies as of April 2025. Starting with a static revenue loss of $10.025 billion annually ($100 billion gains baseline), the study employs static and dynamic scoring to assess fiscal impacts, ranging from optimistic tariff-driven growth to severe recessionary shocks, culminating in a V-shaped recovery scenario.
Key Concepts Examined
-
Static Scoring Baseline:
-
PAYGO/CBO rules estimate a $10.025 billion/year loss ($100.25 billion/10 years), assuming no economic feedback, providing a conservative starting point.
-
-
Dynamic Scoring with Tariff Optimism:
-
Assumes Trump’s tariffs boost domestic investment and GDP:
-
Moderate ($50B tariffs, 0.3% GDP): Reduces loss to $7.5 billion/year ($75 billion/10 years).
-
Ultimate ($200B tariffs, 2% GDP): Yields a $207 billion/year surplus ($2.07 trillion/10 years), with $55 billion in U.S. gains and $20 billion GDP revenue.
-
-
-
Recessionary Stress Tests:
-
Incorporates the April 2025 market selloff:
-
Moderate ($180B tariffs, 1.5% GDP, 2% recession): $177 billion/year ($1.77 trillion/10 years), resilient despite a $56 billion year 1 hit.
-
Harsher ($150B tariffs, 1% GDP, 3% recession): $144 billion/year ($1.44 trillion/10 years), with year 1 at $114.99 billion.
-
Extreme ($120B tariffs, 0.75% GDP, 4% recession): $113 billion/year ($1.13 trillion/10 years), year 1 at $75.99 billion, barely positive.
-
-
-
V-Shaped Recovery:
-
Harsher Base ($120B tariffs, 4% recession): Adjusted to a sharp rebound-2% GDP in year 2, 2.5% in year 3, stabilizing at 2% by year 5-results in $119 billion/year ($1.19 trillion/10 years). Year 1 holds at $75.99 billion, surging to $125.8675 billion by year 3, proving Trump’s long-term vision.
-
-
Tariff Dependency: $120B-$200B tariff revenue consistently offsets the static loss, driving surpluses even in deep recessions, with $120 billion sustaining a $75.99 billion floor in year 1 of the harshest scenario.
-
Recovery Dynamics: The V-shaped recovery’s rapid 2%-2.5% GDP rebound and $100 billion U.S. gains by year 5 validate Trump’s tariff claims if executed swiftly, though slower recoveries (0.75% GDP) limit surpluses to $113 billion/year.
-
Fiscal Spectrum: Outcomes range from a $100.25 billion static loss to a $2.07 trillion surplus, with the V-shaped $1.19 trillion balancing realism and optimism-$880 billion below the ultimate peak but $1.29 trillion above the static loss.
-
Policy Potential: A $1.19 trillion surplus supports significant fiscal initiatives, though short-term recessionary costs temper the ultimate $2.07 trillion potential, highlighting execution risks.
-
Economic Viability: Success hinges on tariff revenue stability ($120B minimum) and a V-shaped recovery exceeding typical post-recession growth (e.g., 1.5% vs. 2%), requiring near-flawless tariff implementation and minimal global retaliation.
Conclusion
The analyses demonstrate that Trump’s tariff-driven economic strategy, paired with the proposed tax structure, can transform a static revenue loss into a substantial surplus-peaking at $2.07 trillion under ideal conditions and holding at $1.19 trillion with a V-shaped recovery after a 4% recession. While resilient, the policy’s long-term success depends on rapid economic recovery and sustained tariff yields, with the harsher tests underscoring vulnerabilities to trade wars and prolonged downturns.
What is the Current Capital Gains Tax Rate?
-
Short-term capital gains (assets held for one year or less) are taxed at your ordinary income tax rate, which can range from 10% to 37% depending on your taxable income and filing status.
-
Long-term capital gains (assets held for more than one year) have preferential rates:
-
0% for individuals with taxable income up to $47,025 (single) or $94,050 (married filing jointly).
-
15% for individuals with taxable income between $47,026 and $518,900 (single) or $94,051 and $583,750 (married filing jointly).
-
20% for higher earners above those thresholds.
-
How Has the Rate Been Modified over the Years?
The capital gains tax rate in the United States has seen several modifications over the past few decades, shaped by legislative changes and economic priorities. Here’s a concise overview of the recent history, focusing on key shifts since the late 1990s:
-
1997 – Taxpayer Relief Act: This law lowered the maximum long-term capital gains rate from 28% to 20% for assets held over 18 months (later simplified to one year). It also introduced a 10% rate for lower-income taxpayers, marking a significant reduction from prior levels and establishing the modern framework of tiered rates.
-
2001 – Economic Growth and Tax Relief Reconciliation Act: This act further reduced rates, introducing an 8% rate for lower-income taxpayers on assets held over five years, while the 20% rate dropped to 18% for the same holding period. These changes were temporary, set to expire in 2010, reflecting a push to incentivize long-term investment.
-
2003 – Jobs and Growth Tax Relief Reconciliation Act: A major adjustment came here, dropping the long-term rates to 15% for most taxpayers and 5% for lower-income brackets (assets held over one year). This also aligned qualified dividends with capital gains rates, a shift that persists today. These cuts were retroactive to May 2003, showing Congress’s willingness to adjust rates mid-year.
-
2005-2012 – Extensions and Adjustments: The 15% and 5% rates were extended multiple times (e.g., through the Tax Increase Prevention and Reconciliation Act of 2005 and beyond 2010). In 2012, the American Taxpayer Relief Act made these rates permanent for most, but introduced a 20% rate for the highest earners (taxable income above ~$400,000 single/$450,000 joint, adjusted annually), alongside the 0% and 15% tiers. This also locked in the dividend alignment.
-
2013 – Net Investment Income Tax (NIIT): While not a direct change to capital gains rates, the Affordable Care Act added a 3.8% NIIT on investment income (including capital gains) for high earners (above $200,000 single/$250,000 joint), effectively raising the top combined rate to 23.8%.
-
2017 – Tax Cuts and Jobs Act (TCJA): The TCJA didn’t alter the 0%, 15%, and 20% rate structure but adjusted how income thresholds are calculated, tying them to specific dollar amounts rather than ordinary income tax brackets. These thresholds ($44,625/$89,250 for 0%; $492,300/$553,850 for 15% in 2018) now rise with inflation, not tax bracket changes, subtly shifting who qualifies for each rate over time.
-
2024-2025 – Current State: As of April 04, 2025, the federal long-term rates remain 0%, 15%, and 20%, with 2025 thresholds adjusted for inflation (e.g., $48,350 single/$96,700 joint for 0%; $533,400/$609,350 for 20%). Short-term gains continue to be taxed as ordinary income (10%-37%). No major legislative changes have hit since 2017, though proposals-like Biden’s FY2025 budget suggesting a 39.6% top rate for millionaires or Harris’s 28% idea-have floated without traction yet.
Modified Capital Gains Rate Structure for US Firms
Creating a modified capital gains tax structure with a lower rate for investments in domestic U.S. firms would aim to incentivize investment in American companies, potentially boosting economic growth, job creation, and competitiveness. Here’s how such a system could be structured, along with some practical considerations:
Possible Structure
-
Tiered Long-Term Capital Gains Rates:
-
Standard Rate: Retain the current long-term rates (0%, 15%, 20%) for gains from investments in foreign firms or non-qualifying assets.
-
Domestic Rate: Introduce a reduced rate for gains from U.S.-based firms, such as:
-
0% for taxable income up to $50,000 (single) or $100,000 (joint).
-
10% for income between $50,001 and $500,000 (single) or $100,001 and $600,000 (joint).
-
15% for income above those thresholds.
-
-
This keeps the top rate below the current 20%, rewarding domestic investment while maintaining progressivity.
-
-
Definition of “Domestic U.S. Firm”:
-
Eligibility Criteria: A firm could qualify if it’s incorporated in the U.S., has its primary headquarters here, or derives a majority (e.g., 51%+) of its revenue from U.S. operations. Alternatively, it could be tied to job creation-e.g., firms maintaining a certain percentage of U.S.-based employees.
-
Asset Types: Apply the lower rate to stocks, bonds, or real estate tied to qualifying firms, excluding foreign subsidiaries unless they meet strict domestic benchmarks.
-
-
Holding Period Requirement:
-
To prevent short-term speculation, the lower rate could require a longer holding period (e.g., 2-3 years vs. the current 1-year threshold for long-term gains). This encourages sustained investment in U.S. companies.
-
-
Cap on Benefits:
-
Limit the amount of gains eligible for the lower rate annually (e.g., $1 million per taxpayer) to prevent excessive tax avoidance by high earners restructuring portfolios solely for the discount.
-
-
Integration with Existing Taxes:
-
The Net Investment Income Tax (3.8%) could still apply to maintain revenue and fairness, though Congress might exempt domestic gains to amplify the incentive.
-
Short-term gains (under 1-3 years) would remain taxed at ordinary income rates, regardless of the firm’s origin, to focus the benefit on long-term investment.
-
Example Framework
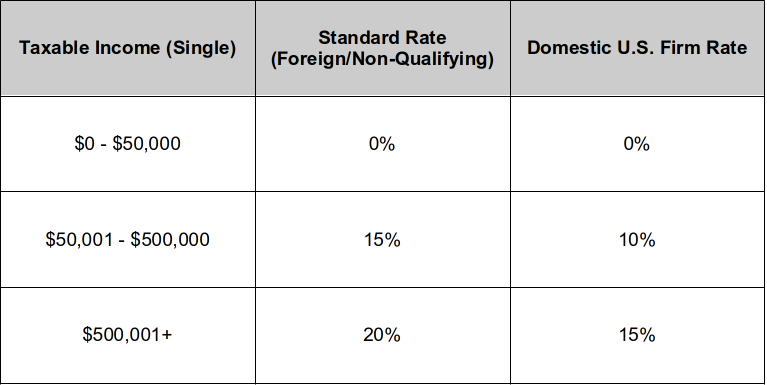
Practical Considerations
-
Revenue Impact: Lowering rates for domestic gains would reduce federal tax revenue, requiring offsets-e.g., closing loopholes like carried interest or raising rates on foreign gains (say, to 25% for top earners).
-
Compliance and Enforcement: The IRS would need clear rules to verify a firm’s “domestic” status, possibly via annual certifications or public company disclosures. This could add administrative complexity.
-
Economic Effects: Proponents might argue this boosts U.S. investment, but critics could point to profit-shifting risks (e.g., firms reclassifying foreign revenue as domestic) or benefits skewing to wealthy investors already holding U.S. stocks.
-
Global Trade Implications: Favoring domestic firms might spark retaliation from trading partners, complicating tax treaties or inviting tariffs.
Legislative Precedent
This idea echoes past policies like the Section 1202 Qualified Small Business Stock (QSBS) provision, which offers 0% capital gains tax on certain U.S. small business investments (up to $10 million in gains) if held for 5+ years. A broader domestic rate could expand this concept, dropping the small-business restriction but keeping a patriotic bent.
Hypothetical Implementation
Congress could pass this via a tax reform bill, defining “domestic” in the Internal Revenue Code and setting rates through reconciliation (avoiding a Senate filibuster). It might look like: “Gains from the sale of qualified U.S. corporate assets held for 3+ years shall be taxed at 75% of the standard long-term rate, subject to annual adjustment.” Pair it with a Treasury study to assess economic impact after 5 years.
Scenario Modeling or Industry Impact
Let’s model a comparison between two investors-one primarily invested in foreign stocks and the other in U.S.-based stocks-under the current capital gains tax structure versus the proposed structure with a lower rate for domestic U.S. firms. We’ll calculate their gains/losses and taxes due, then analyze the differences.
Assumptions
-
Current Rates (2025):
-
Long-term capital gains: 0% ($0-$48,350 single), 15% ($48,351-$533,400), 20% ($533,401+).
-
Net Investment Income Tax (NIIT): 3.8% on gains if income exceeds $200,000.
-
-
Proposed Rates:
-
Standard (foreign/non-qualifying): Same as current (0%, 15%, 20%).
-
Domestic U.S. firms: 0% ($0-$50,000), 10% ($50,001-$500,000), 15% ($500,001+).
-
NIIT applies to both unless specified otherwise.
-
-
Investor Profiles:
-
Both are single filers, hold investments for 3+ years (long-term), and sell in 2025.
-
No state taxes included for simplicity.
-
-
Investment Details:
-
Each invests $1,000,000 initially, sells after appreciation, and has other taxable income.
-
-
Investor A (Foreign Stocks):
-
Initial investment: $1,000,000 in foreign stocks.
-
Sale value: $1,500,000 (50% gain, $500,000 capital gain).
-
Other income: $100,000 (e.g., salary).
-
Total taxable income: $100,000 + $500,000 = $600,000.
-
-
Investor B (U.S. Stocks):
-
Initial investment: $1,000,000 in U.S.-based stocks.
-
Sale value: $1,500,000 (50% gain, $500,000 capital gain).
-
Other income: $100,000.
-
Total taxable income: $100,000 + $500,000 = $600,000.
-
Calculations
Current Structure (2025 Rates)
-
Investor A (Foreign):
-
Taxable income: $600,000.
-
Capital gains rate: 20% (since $600,000 > $533,400).
-
Tax on $500,000 gain: $500,000 × 20% = $100,000.
-
NIIT: $500,000 × 3.8% = $19,000 (income > $200,000).
-
Total tax: $100,000 + $19,000 = $119,000.
-
After-tax gain: $500,000 – $119,000 = $381,000.
-
-
Investor B (U.S.):
-
Taxable income: $600,000.
-
Capital gains rate: 20% (same as above).
-
Tax on $500,000 gain: $500,000 × 20% = $100,000.
-
NIIT: $500,000 × 3.8% = $19,000.
-
Total tax: $100,000 + $19,000 = $119,000.
-
After-tax gain: $500,000 – $119,000 = $381,000.
-
-
Investor A (Foreign):
-
Taxable income: $600,000.
-
Standard rate: 20% (foreign stocks don’t qualify for domestic rate).
-
Tax on $500,000 gain: $500,000 × 20% = $100,000.
-
NIIT: $500,000 × 3.8% = $19,000.
-
Total tax: $100,000 + $19,000 = $119,000.
-
After-tax gain: $500,000 – $119,000 = $381,000.
-
-
Investor B (U.S.):
-
Taxable income: $600,000.
-
Domestic rate: 15% (since $600,000 > $500,000).
-
Tax on $500,000 gain: $500,000 × 15% = $75,000.
-
NIIT: $500,000 × 3.8% = $19,000 (assuming NIIT still applies).
-
Total tax: $75,000 + $19,000 = $94,000.
-
After-tax gain: $500,000 – $94,000 = $406,000.
-
Comparison

Analysis
-
Investor A (Foreign):
-
No change under the proposed structure because foreign stocks don’t qualify for the lower domestic rate. Tax burden and after-tax gain remain identical ($119,000 and $381,000).
-
-
Investor B (U.S.):
-
Benefits significantly from the proposed structure. The capital gains rate drops from 20% to 15%, reducing the base tax from $100,000 to $75,000. With NIIT unchanged, total tax falls from $119,000 to $94,000, boosting after-tax gain by $25,000 (6.6% increase).
-
-
Key Difference:
-
Investor B keeps $25,000 more than Investor A under the proposed system, purely due to the domestic rate discount. This gap reflects the policy’s intent to reward U.S. investment.
-
-
Lower Income: If both had $50,000 other income (total $550,000), Investor A’s tax would stay $119,000 (20% bracket), while Investor B’s base tax would still drop to $75,000 (15%), preserving the $25,000 advantage.
-
No NIIT: If NIIT were waived for domestic gains, Investor B’s tax would fall to $75,000, increasing the gap to $44,000-a stronger incentive but bigger revenue hit for the government.
-
Incentive Effect: The $25,000 savings might nudge investors toward U.S. stocks, especially for high earners in the 20%/15% bracket. Smaller gains (e.g., 15% to 10%) yield less dramatic differences but still favor domestic investment.
-
Revenue Loss: For Investor B alone, the Treasury loses $25,000 per similar case, scalable across millions of taxpayers.
-
Behavior: Investor A might shift to U.S. stocks over time, though transaction costs and market performance could temper this.
Scenarios for Different Income Levels, Gain Sizes, & NIIT Exemptions
Let’s rerun the scenario with varying income levels, including high earners subject to the Net Investment Income Tax (NIIT), and add a case where NIIT drops to 0% for high-income earners investing in U.S. firms like Investor B. We’ll compare Investor A (foreign stocks) and Investor B (U.S. stocks) across three income tiers under the current and proposed structures.
Assumptions
-
Current Rates (2025): 0% ($0-$48,350), 15% ($48,351-$533,400), 20% ($533,401+); NIIT 3.8% if income > $200,000.
-
Proposed Rates:
-
Standard (foreign): 0% ($0-$48,350), 15% ($48,351-$533,400), 20% ($533,401+).
-
Domestic U.S.: 0% ($0-$50,000), 10% ($50,001-$500,000), 15% ($500,001+).
-
NIIT: 3.8% unless specified (Scenario 3: 0% for U.S. high earners).
-
-
Investment: $1,000,000 initial, sold for $1,500,000 ($500,000 gain), held 3+ years.
-
Income Levels (Single Filers):
-
Low: $40,000 other income (total $540,000 with gain).
-
Middle: $100,000 other income (total $600,000).
-
High: $600,000 other income (total $1,100,000).
-
Scenario 1: Current Structure
Low Income ($40,000 + $500,000 = $540,000)
-
Investor A (Foreign):
-
Rate: 15% ($540,000 just over $533,400, but gain portion taxed from $48,351).
-
Tax: $500,000 × 15% = $75,000.
-
NIIT: $500,000 × 3.8% = $19,000.
-
Total tax: $94,000.
-
After-tax gain: $406,000.
-
-
Investor B (U.S.):
-
Same as A: $94,000 tax, $406,000 after-tax gain.
-
-
Investor A (Foreign):
-
Rate: 20% ($600,000 > $533,400).
-
Tax: $500,000 × 20% = $100,000.
-
NIIT: $19,000.
-
Total tax: $119,000.
-
After-tax gain: $381,000.
-
-
Investor B (U.S.):
-
Same as A: $119,000 tax, $381,000 after-tax gain.
-
-
Investor A (Foreign):
-
Rate: 20%.
-
Tax: $100,000.
-
NIIT: $19,000.
-
Total tax: $119,000.
-
After-tax gain: $381,000.
-
-
Investor B (U.S.):
-
Same as A: $119,000 tax, $381,000 after-tax gain.
-
Scenario 2: Proposed Structure (NIIT Applies)
Low Income ($540,000)
-
Investor A (Foreign):
-
Rate: 15%.
-
Tax: $75,000.
-
NIIT: $19,000.
-
Total tax: $94,000.
-
After-tax gain: $406,000.
-
-
Investor B (U.S.):
-
Rate: 10% ($540,000 > $500,000, but gain taxed from $50,001).
-
Tax: $500,000 × 10% = $50,000.
-
NIIT: $19,000.
-
Total tax: $69,000.
-
After-tax gain: $431,000.
-
-
Investor A (Foreign):
-
Rate: 20%.
-
Tax: $100,000.
-
NIIT: $19,000.
-
Total tax: $119,000.
-
After-tax gain: $381,000.
-
-
Investor B (U.S.):
-
Rate: 15%.
-
Tax: $500,000 × 15% = $75,000.
-
NIIT: $19,000.
-
Total tax: $94,000.
-
After-tax gain: $406,000.
-
-
Investor A (Foreign):
-
Rate: 20%.
-
Tax: $100,000.
-
NIIT: $19,000.
-
Total tax: $119,000.
-
After-tax gain: $381,000.
-
-
Investor B (U.S.):
-
Rate: 15%.
-
Tax: $75,000.
-
NIIT: $19,000.
-
Total tax: $94,000.
-
After-tax gain: $406,000.
-
Scenario 3: Proposed Structure (NIIT 0% for U.S. High Earners)
Low Income ($540,000)
-
Investor A (Foreign): Same as Scenario 2: $94,000 tax, $406,000 gain.
-
Investor B (U.S.): Same as Scenario 2: $69,000 tax, $431,000 gain (NIIT applies, income < $1M).
-
Investor A (Foreign): Same as Scenario 2: $119,000 tax, $381,000 gain.
-
Investor B (U.S.): Same as Scenario 2: $94,000 tax, $406,000 gain (NIIT applies).
-
Investor A (Foreign):
-
Rate: 20%.
-
Tax: $100,000.
-
NIIT: $19,000.
-
Total tax: $119,000.
-
After-tax gain: $381,000.
-
-
Investor B (U.S.):
-
Rate: 15%.
-
Tax: $75,000.
-
NIIT: 0% (high earner exemption).
-
Total tax: $75,000.
-
After-tax gain: $425,000.
-
Comparison Table

Analysis
-
Low Income:
-
Investor B saves $25,000 in tax ($94K → $69K), gaining $25,000 more ($406K → $431K) under the proposed structure due to the 10% rate vs. 15%. No NIIT change here.
-
-
Middle Income:
-
Investor B saves $25,000 ($119K → $94K), gaining $25,000 more ($381K → $406K) with the 15% rate vs. 20%. NIIT persists.
-
-
High Income:
-
With NIIT: Same $25,000 savings as middle income ($119K → $94K, $381K → $406K).
-
Without NIIT: Investor B saves $44,000 ($119K → $75K), gaining $44,000 more ($381K → $425K), amplifying the domestic incentive.
-
-
Investor A: Unaffected across all scenarios-foreign stocks see no rate relief.
-
Investor B: Benefits grow with income and peak when NIIT is cut:
-
Low: +$25,000 gain.
-
Middle: +$25,000 gain.
-
High: +$25,000 (NIIT) or +$44,000 (no NIIT).
-
-
NIIT Elimination: Adds $19,000 in savings for high earners, making U.S. investment far more attractive (11.5% effective tax rate vs. 23.8% for foreign).
-
Incentive Gradient: The gap widens most for high earners without NIIT, potentially shifting their portfolios heavily toward U.S. firms.
-
Revenue Cost: Dropping NIIT for high-income U.S. investors cuts Treasury income significantly-e.g., $19,000 per Investor B at scale.
-
Fairness: Low/middle earners see consistent but smaller benefits, while high earners could dominate the policy’s impact.
Removing Progressivity
Let’s rerun the scenario with a flattened, less progressive capital gains tax structure, incorporating our specifications: a 0% rate for low-income earners with a raised, inflation-indexed threshold, a flat 15% rate for foreign/non-qualifying gains, a single-digit 7.5% rate for domestic U.S. firms, and the elimination of the Net Investment Income Tax (NIIT) for qualifying U.S. investments. We’ll compare Investor A (foreign stocks) and Investor B (U.S. stocks) across the same income levels.
Assumptions
-
New Structure:
-
Low-income threshold: Raised to $75,000 (single), indexed for inflation (assume 3% from 2025 base, roughly $77,250 in 2026, but we’ll use $75,000 for simplicity as of April 2025).
-
Foreign/Non-qualifying: Flat 15% for taxable income > $75,000.
-
Domestic U.S.: Flat 7.5% for taxable income > $75,000.
-
NIIT: 3.8% applies to foreign gains if income > $200,000; 0% for qualifying U.S. gains.
-
-
Investment: $1,000,000 initial, sold for $1,500,000 ($500,000 gain), held 3+ years.
-
Income Levels (Single Filers):
-
Low: $40,000 other income (total $540,000).
-
Middle: $100,000 other income (total $600,000).
-
High: $600,000 other income (total $1,100,000).
-
-
Comparison: Current 2025 rates (0%/15%/20% + NIIT) vs. this new structure.
Scenario 1: Current Structure (2025 Rates)
Low Income ($40,000 + $500,000 = $540,000)
-
Investor A (Foreign):
-
Rate: 15% ($540,000 > $48,350).
-
Tax: $500,000 × 15% = $75,000.
-
NIIT: $500,000 × 3.8% = $19,000.
-
Total tax: $94,000.
-
After-tax gain: $406,000.
-
-
Investor B (U.S.):
-
Same as A: $94,000 tax, $406,000 gain.
-
-
Investor A (Foreign):
-
Rate: 20% ($600,000 > $533,400).
-
Tax: $500,000 × 20% = $100,000.
-
NIIT: $19,000.
-
Total tax: $119,000.
-
After-tax gain: $381,000.
-
-
Investor B (U.S.):
-
Same as A: $119,000 tax, $381,000 gain.
-
-
Investor A (Foreign):
-
Rate: 20%.
-
Tax: $100,000.
-
NIIT: $19,000.
-
Total tax: $119,000.
-
After-tax gain: $381,000.
-
-
Investor B (U.S.):
-
Same as A: $119,000 tax, $381,000 gain.
-
Scenario 2: New Structure
Low Income ($540,000)
-
Investor A (Foreign):
-
Rate: 15% ($540,000 > $75,000).
-
Tax: $500,000 × 15% = $75,000.
-
NIIT: $19,000 (income > $200,000).
-
Total tax: $94,000.
-
After-tax gain: $406,000.
-
-
Investor B (U.S.):
-
Rate: 7.5% ($540,000 > $75,000).
-
Tax: $500,000 × 7.5% = $37,500.
-
NIIT: 0% (U.S. exemption).
-
Total tax: $37,500.
-
After-tax gain: $462,500.
-
-
Investor A (Foreign):
-
Rate: 15%.
-
Tax: $75,000.
-
NIIT: $19,000.
-
Total tax: $94,000.
-
After-tax gain: $406,000.
-
-
Investor B (U.S.):
-
Rate: 7.5%.
-
Tax: $37,500.
-
NIIT: 0%.
-
Total tax: $37,500.
-
After-tax gain: $462,500.
-
-
Investor A (Foreign):
-
Rate: 15%.
-
Tax: $75,000.
-
NIIT: $19,000.
-
Total tax: $94,000.
-
After-tax gain: $406,000.
-
-
Investor B (U.S.):
-
Rate: 7.5%.
-
Tax: $37,500.
-
NIIT: 0%.
-
Total tax: $37,500.
-
After-tax gain: $462,500.
-
Comparison Table

Analysis
-
Investor A (Foreign):
-
Low: No change ($94,000 tax, $406,000 gain) as the 15% rate matches the current 15% bracket, and NIIT persists.
-
Middle/High: Saves $25,000 ($119,000 → $94,000) due to the drop from 20% to 15%, gaining $25,000 ($381,000 → $406,000). NIIT remains a factor.
-
-
Investor B (U.S.):
-
Low: Saves $56,500 ($94,000 → $37,500) with the 7.5% rate and no NIIT, gaining $56,500 ($406,000 → $462,500).
-
Middle/High: Saves $81,500 ($119,000 → $37,500) due to the 20% → 7.5% drop plus NIIT elimination, gaining $81,500 ($381,000 → $462,500).
-
-
Key Differences:
-
Low: B gains $56,500 more than A ($462,500 vs. $406,000).
-
Middle/High: B gains $56,500 more than A ($462,500 vs. $406,000), despite A’s $25,000 improvement.
-
-
Flattening Effect: The 0% threshold rise to $75,000 doesn’t impact these investors (all > $75,000), but the flat rates simplify and amplify the U.S. advantage.
-
Incentive Boost: The 7.5% rate and NIIT exemption create a stark contrast-Investor B keeps 92.5% of gains vs. A’s 81.2% (middle/high), a 14% relative increase in after-tax returns for U.S. investment.
-
Revenue Hit: Treasury loses $56,500-$81,500 per Investor B, plus $25,000 per middle/high Investor A, suggesting a significant cost to prioritize domestic investment.
-
Behavior Shift: The $56,500+ gap could heavily tilt portfolios toward U.S. firms, especially for high earners freed from NIIT.
-
Equity: Low earners below $75,000 would see no tax (not modeled here), while all others face a flat, predictable rate-less progressive but simpler.
-
Smaller Gains: A $100,000 gain at 7.5% (U.S.) = $7,500 tax vs. 15% + 3.8% (foreign) = $18,800 tax, still favoring B by $11,300.
-
Inflation Indexing: By 2030, $75,000 might rise to ~$90,000, expanding the 0% bracket but not affecting these cases.
Adjusting Rate Based on Holding Periods
Let’s rerun the scenario with a tiered, bonus lower rate structure for qualifying U.S. domestic stocks based on holding periods, while keeping the foreign/non-qualifying rate unchanged. We’ll compare Investor A (foreign stocks) and Investor B (U.S. stocks) across the same income levels, testing different holding periods for Investor B.
Assumptions
-
New Structure:
-
Foreign/Non-qualifying: Flat 15% for taxable income > $75,000; NIIT 3.8% if income > $200,000.
-
Domestic U.S.:
-
7.5% for 1-3 years.
-
5% for 3-5 years.
-
2.5% for 5-10 years.
-
0% for 10+ years.
-
NIIT: 0% for all qualifying U.S. gains.
-
-
Low-income threshold: $75,000 (single), indexed for inflation (using $75,000 for 2025).
-
-
Investment: $1,000,000 initial, sold for $1,500,000 ($500,000 gain).
-
Income Levels (Single Filers):
-
Low: $40,000 other income (total $540,000).
-
Middle: $100,000 other income (total $600,000).
-
High: $600,000 other income (total $1,100,000).
-
-
Holding Periods for Investor B: We’ll test 2 years (7.5%), 4 years (5%), 7 years (2.5%), and 12 years (0%).
Scenario 1: Current Structure (2025 Rates)
Low Income ($540,000)
-
Investor A (Foreign): $94,000 tax, $406,000 gain (15% + 3.8% NIIT).
-
Investor B (U.S.): $94,000 tax, $406,000 gain (same as A).
-
Investor A (Foreign): $119,000 tax, $381,000 gain (20% + 3.8% NIIT).
-
Investor B (U.S.): $119,000 tax, $381,000 gain.
-
Investor A (Foreign): $119,000 tax, $381,000 gain.
-
Investor B (U.S.): $119,000 tax, $381,000 gain.
Scenario 2: New Structure
Investor A (Foreign) – All Income Levels
-
Low ($540,000): 15% ($75,000) + NIIT ($19,000) = $94,000 tax, $406,000 gain.
-
Middle ($600,000): $94,000 tax, $406,000 gain.
-
High ($1,100,000): $94,000 tax, $406,000 gain.
-
No change across holding periods-foreign stocks stay at 15% + NIIT.
-
2 Years (7.5%):
-
Tax: $500,000 × 7.5% = $37,500.
-
NIIT: 0%.
-
Total tax: $37,500.
-
Gain: $462,500.
-
-
4 Years (5%):
-
Tax: $500,000 × 5% = $25,000.
-
Total tax: $25,000.
-
Gain: $475,000.
-
-
7 Years (2.5%):
-
Tax: $500,000 × 2.5% = $12,500.
-
Total tax: $12,500.
-
Gain: $487,500.
-
-
12 Years (0%):
-
Tax: $0.
-
Gain: $500,000.
-
-
2 Years (7.5%): $37,500 tax, $462,500 gain.
-
4 Years (5%): $25,000 tax, $475,000 gain.
-
7 Years (2.5%): $12,500 tax, $487,500 gain.
-
12 Years (0%): $0 tax, $500,000 gain.
-
2 Years (7.5%): $37,500 tax, $462,500 gain.
-
4 Years (5%): $25,000 tax, $475,000 gain.
-
7 Years (2.5%): $12,500 tax, $487,500 gain.
-
12 Years (0%): $0 tax, $500,000 gain.
Comparison Table

Analysis
-
Investor A (Foreign):
-
Consistent across all levels: $94,000 tax, $406,000 gain. Saves $25,000 vs. current middle/high ($119,000 → $94,000) due to 15% flat rate, but no holding period benefits.
-
-
Investor B (U.S.):
-
2 Years (7.5%): Saves $56,500 (low) or $81,500 (middle/high) vs. current, gaining $462,500.
-
4 Years (5%): Saves $69,000 (low) or $94,000 (middle/high), gaining $475,000.
-
7 Years (2.5%): Saves $81,500 (low) or $106,500 (middle/high), gaining $487,500.
-
12 Years (0%): Saves $94,000 (low) or $119,000 (middle/high), keeping the full $500,000.
-
-
Key Differences:
-
Low: B’s advantage over A grows from $56,500 (2 yrs) to $94,000 (12 yrs).
-
Middle/High: B’s edge rises from $56,500 (2 yrs) to $94,000 (12 yrs), with A’s gain fixed at $25,000.
-
-
Holding Period Incentive:
-
Each tier cuts the effective rate by ~2.5%-7.5%, adding $12,500-$37,500 in after-tax gain per step.
-
10+ years at 0% maximizes retention, a 18.8% effective tax savings vs. foreign (15% + 3.8%).
-
-
Long-Term Bias: The 0% rate at 10+ years could lock capital into U.S. firms, boosting stability but reducing liquidity. The 2.5%-5% tiers encourage 3-10 year holds, balancing flexibility and reward.
-
Revenue Cost: Treasury loses $37,500-$119,000 per Investor B, escalating with longer holds-potentially billions if widely adopted.
-
Behavior: Investors might delay sales to hit lower tiers, especially 0%, shifting market dynamics toward U.S. equities.
-
Equity: Flat rates above $75,000 simplify taxes but favor U.S. investors universally, with no income-based progressivity beyond the 0% threshold.
-
Smaller Gain ($100,000): 7.5% = $7,500 tax, 5% = $5,000, 2.5% = $2,500, 0% = $0 vs. foreign $18,800-still a $11,300-$18,800 gap.
-
Below $75,000: Total income < $75,000 (e.g., $50,000 gain + $20,000 other) = 0% tax for both, but rare with large gains.
Impacts of PAYGO and CBO Rules
Let’s assess the revenue cost of the proposed capital gains tax structure from your latest scenario using current PAYGO (Pay-As-You-Go) and Congressional Budget Office (CBO) rules without dynamic scoring. Under these rules, the CBO estimates the budgetary impact of legislation based on static scoring-meaning it calculates revenue changes without factoring in potential macroeconomic feedback effects (e.g., economic growth or behavioral shifts beyond direct tax responses). PAYGO requires that any revenue loss or spending increase be offset to remain deficit-neutral over 5- and 10-year windows, with costs recorded on scorecards by the Office of Management and Budget (OMB).
Proposed Structure Recap
-
Foreign/Non-qualifying: Flat 15% for income > $75,000; NIIT (3.8%) applies if income > $200,000.
-
Domestic U.S.:
-
7.5% (1-3 years).
-
5% (3-5 years).
-
2.5% (5-10 years).
-
0% (10+ years).
-
NIIT: 0% for qualifying U.S. gains.
-
-
Low-income threshold: $75,000 (single), indexed for inflation.
-
Long-term capital gains: 0% ($0-$48,350), 15% ($48,351-$533,400), 20% ($533,401+).
-
NIIT: 3.8% if income > $200,000.
Revenue Cost Estimation Approach
Under current PAYGO and CBO rules without dynamic scoring:
-
Baseline: Revenue from capital gains under current law (0%/15%/20% + NIIT).
-
Proposed: Revenue under the new structure, calculated as a reduction from the baseline.
-
Static Scoring: Assumes no change in total capital gains realizations (e.g., taxpayers don’t shift behavior significantly beyond basic responses like holding periods), focusing only on rate changes.
-
PAYGO Scorecard: Revenue losses must be averaged over 5 and 10 years and offset to avoid sequestration.
Scenario Data
Using the prior example:
-
Investment: $1,000,000 → $1,500,000 ($500,000 gain).
-
Income Levels: Low ($540,000), Middle ($600,000), High ($1,100,000).
-
Holding Periods for Investor B: 2 years (7.5%), 4 years (5%), 7 years (2.5%), 12 years (0%).
-
Low ($540,000): 15% ($75,000) + 3.8% NIIT ($19,000) = $94,000.
-
Middle ($600,000): 20% ($100,000) + 3.8% ($19,000) = $119,000.
-
High ($1,100,000): 20% ($100,000) + 3.8% ($19,000) = $119,000.
-
Investor A (Foreign):
-
All levels: 15% ($75,000) + 3.8% ($19,000) = $94,000.
-
-
Investor B (U.S.):
-
2 years (7.5%): $37,500, NIIT 0%.
-
4 years (5%): $25,000, NIIT 0%.
-
7 years (2.5%): $12,500, NIIT 0%.
-
12 years (0%): $0, NIIT 0%.
-
-
Investor A (Foreign):
-
Low: $94,000 – $94,000 = $0 loss.
-
Middle/High: $119,000 – $94,000 = $25,000 gain (revenue increase).
-
-
Investor B (U.S.):
-
Low:
-
2 yrs: $94,000 – $37,500 = $56,500 loss.
-
4 yrs: $94,000 – $25,000 = $69,000 loss.
-
7 yrs: $94,000 – $12,500 = $81,500 loss.
-
12 yrs: $94,000 – $0 = $94,000 loss.
-
-
Middle/High:
-
2 yrs: $119,000 – $37,500 = $81,500 loss.
-
4 yrs: $119,000 – $25,000 = $94,000 loss.
-
7 yrs: $119,000 – $12,500 = $106,500 loss.
-
12 yrs: $119,000 – $0 = $119,000 loss.
-
-
Aggregate Revenue Cost
To estimate total revenue cost, we need the distribution of gains across taxpayers and holding periods. Without precise data, let’s assume:
-
50/50 Split: Half of gains are foreign (Investor A), half U.S. (Investor B).
-
U.S. Gains Distribution: Evenly split across 2, 4, 7, and 12 years (25% each).
-
Baseline Revenue:
-
Low (15% + 3.8% = 18.8%): $18.8 billion on $100B.
-
Middle/High (20% + 3.8% = 23.8%): $23.8 billion on $100B.
-
Assume 50% low, 50% middle/high: ($18.8B + $23.8B) / 2 = $21.3 billion.
-
-
Proposed Revenue:
-
Foreign ($50B): $94,000 / $500,000 × $50B = $9.4 billion.
-
U.S. ($50B):
-
2 yrs ($12.5B): $37,500 / $500,000 × $12.5B = $0.9375B.
-
4 yrs ($12.5B): $25,000 / $500,000 × $12.5B = $0.625B.
-
7 yrs ($12.5B): $12,500 / $500,000 × $12.5B = $0.3125B.
-
12 yrs ($12.5B): $0 = $0.
-
-
Total U.S.: $1.875 billion.
-
Total Proposed: $9.4B + $1.875B = $11.275 billion.
-
-
Revenue Loss: $21.3B – $11.275B = $10.025 billion annually.
-
5-Year: $10.025B × 5 = $50.125 billion.
-
10-Year: $10.025B × 10 = $100.25 billion.
-
Annual Average: $10.025 billion (5-year), $10.025 billion (10-year).
-
Static Scoring: The $10 billion annual loss reflects only rate reductions, not shifts in investment behavior or economic growth, per CBO rules without dynamic scoring.
-
PAYGO Impact: This $100.25 billion 10-year loss must be offset (e.g., spending cuts or revenue increases) to avoid sequestration. Foreign gains generate a slight revenue boost for middle/high earners, but U.S. tiered rates-especially 0% at 10+ years-drive significant losses.
-
Revenue Cost: Yes, this is the cost under current PAYGO and CBO static rules. The tiered U.S. rates (7.5% to 0%) and NIIT elimination amplify the loss vs. a flat 15% foreign rate.
-
Distribution: Real-world holding period splits (e.g., more 1-3 year holds) could lower the loss; more 10+ year holds would raise it.
-
Volume: $100B is illustrative; actual gains vary yearly (e.g., $300B-$500B historically).
Applying Dynamic Scoring
Let’s apply dynamic scoring to the revenue cost estimate of the proposed capital gains tax structure, factoring in boosted economic activity and increased domestic investment spurred by the preferential lower rates for qualifying U.S. domestic stocks. Unlike static scoring, dynamic scoring accounts for macroeconomic feedback effects-such as higher GDP growth, increased investment, and changes in taxable income-resulting from the policy change. We’ll build on the prior $10.025 billion annual revenue loss estimate and adjust it based on reasonable assumptions about economic behavior.
Proposed Structure Recap
-
Foreign/Non-qualifying: 15% (> $75,000); NIIT 3.8% (> $200,000).
-
Domestic U.S.:
-
7.5% (1-3 years), 5% (3-5 years), 2.5% (5-10 years), 0% (10+ years).
-
NIIT: 0% for U.S. gains.
-
-
Static Loss: $10.025 billion/year on $100 billion in gains (50% foreign, 50% U.S., evenly split across U.S. holding periods).
Dynamic Scoring Assumptions
Dynamic scoring requires estimating how lower rates (especially 0% at 10+ years) incentivize behavior and economic outcomes. Here’s a framework based on economic literature and policy analogs (e.g., 2003 tax cuts, QSBS impacts):
-
Increased Domestic Investment:
-
Shift from Foreign to U.S.: Lower rates (7.5% to 0% vs. 18.8%-23.8%) could shift investment from foreign to U.S. stocks. Assume 20% of the $50 billion foreign gains ($10 billion) moves to U.S. stocks over 5 years, phased in at 4% annually ($2 billion/year).
-
New Investment: Lower rates may unlock “locked-in” capital (investors holding to avoid taxes) and attract new funds. Assume a 10% increase in total U.S. gains ($5 billion/year) from new activity.
-
-
Holding Period Shift:
-
Investors extend holds to hit lower tiers (e.g., 5%, 2.5%, 0%). Assume the initial 25% split across 2, 4, 7, and 12 years shifts to 20% (2 yrs), 20% (4 yrs), 25% (7 yrs), 35% (12 yrs) by year 5, reflecting a preference for 0% tax.
-
-
Economic Growth:
-
Increased U.S. investment boosts GDP via higher corporate earnings, job creation, and consumer spending. Historical studies (e.g., Joint Committee on Taxation, 2003 cuts) suggest a 0.1%-0.5% GDP increase from capital gains cuts. Assume 0.3% annual GDP growth ($60 billion on a $20 trillion GDP), with 20% ($12 billion) taxable at ordinary rates (avg. 25% = $3 billion revenue).
-
-
Revenue Feedback:
-
Elasticity: Capital gains realizations are elastic (estimates range from 0.5 to 1.0); assume 0.7-each 1% rate cut increases realizations by 0.7%. U.S. rates drop from ~20% to 7.5%-0%, a 12.5%-20% reduction, boosting U.S. gains by 8.75%-14% (avg. 11.375%, or $5.6875 billion on $50 billion).
-
Offset: Higher GDP and wages increase other tax revenues (income, payroll), partially offsetting the loss.
-
Revised Revenue Calculation
Year 1 (Initial Impact)
-
Baseline Gains: $100 billion ($50B foreign, $50B U.S.).
-
Static Loss: $10.025 billion (as calculated).
-
Dynamic Adjustments:
-
Foreign to U.S. Shift: $2 billion moves to U.S. (15% + 3.8% = $376 million revenue) → U.S. avg. rate (3.125% = $62.5 million). Loss: $313.5 million.
-
New U.S. Gains: $5 billion × 3.125% = $156.25 million revenue (vs. $0 in baseline).
-
Elasticity Boost: $5.6875 billion × 3.125% = $177.73 million revenue.
-
GDP Feedback: $3 billion revenue.
-
-
Total Revenue:
-
Static: $11.275 billion.
-
Dynamic Add-ons: $156.25M + $177.73M + $3B = $3.33398 billion.
-
New Total: $14.60898 billion.
-
-
Revised Loss: $21.3B – $14.609B = $6.691 billion.
-
Adjusted Gains:
-
Foreign: $40B (after $10B shift).
-
U.S.: $65B ($50B + $10B shift + $5B new).
-
U.S. Split: 20% ($13B) at 7.5%, 20% ($13B) at 5%, 25% ($16.25B) at 2.5%, 35% ($22.75B) at 0%.
-
-
Revenue:
-
Foreign: $40B × 18.8% = $7.52 billion.
-
U.S.:
-
$13B × 7.5% = $0.975B.
-
$13B × 5% = $0.65B.
-
$16.25B × 2.5% = $0.40625B.
-
$22.75B × 0% = $0.
-
-
Total U.S.: $2.03125 billion.
-
GDP Feedback: $3 billion (steady).
-
-
Total Revenue: $7.52B + $2.03125B + $3B = $12.55125 billion.
-
Revised Loss: $21.3B – $12.55125B = $8.74875 billion.
-
Linear Transition: Loss decreases from $6.691B (Year 1) to $8.749B (Year 5), then stabilizes as holding shifts peak. Assume average ~$7.5 billion/year.
-
10-Year Total: $7.5B × 10 = $75 billion (vs. $100.25B static).
-
Annual Loss: $7.5 billion (average, vs. $10.025B static).
-
5-Year: $37.5 billion (vs. $50.125B static).
-
10-Year: $75 billion (vs. $100.25B static).
-
Reduction: ~25% lower loss due to dynamic effects ($25.25B less over 10 years).
-
Feedback Effects:
-
Investment Shift: $10B moving to U.S. stocks adds taxable gains at lower rates, softening the loss.
-
New Activity: $5B in fresh U.S. investment generates $156M-$203M/year in revenue.
-
Elasticity: 11.375% more U.S. gains adds ~$178M initially, growing with volume.
-
GDP: $3B in broader tax revenue offsets ~30% of the static loss annually.
-
-
PAYGO: Still requires $75B in 10-year offsets, but dynamic scoring makes it more palatable vs. $100.25B.
-
Caveats: Assumes moderate growth (0.3% GDP); higher (0.5%) or lower (0.1%) impacts could shift the loss to $5B-$9B/year. Behavioral shifts (e.g., 50% to 0% holds) could push it back toward static levels.
-
Static: $10.025B/year assumes no growth, pure rate-cut cost.
-
Dynamic: $7.5B/year reflects investment and GDP boosts, aligning with CBO/JCT dynamic models (e.g., 20%-30% offset for capital gains cuts).
Assuming Positive Effects of Trump Tariffs
Let’s re-evaluate the revenue cost of the proposed capital gains tax structure with dynamic scoring, this time assuming that President Trump’s assertion about tariffs is correct-specifically, that his tariff policies will strengthen the U.S. economy, drive significant domestic investment, support working families, and restore American prosperity. We’ll integrate this assumption into the dynamic scoring model, positing that tariffs amplify the economic benefits of the lower capital gains rates on U.S. domestic stocks, leading to greater investment, economic growth, and taxable activity. This builds on the prior framework, adjusting for a tariff-driven boost.
Proposed Capital Gains Structure Recap
-
Foreign/Non-qualifying: 15% (> $75,000); NIIT 3.8% (> $200,000).
-
Domestic U.S.:
-
7.5% (1-3 years), 5% (3-5 years), 2.5% (5-10 years), 0% (10+ years).
-
NIIT: 0% for U.S. gains.
-
-
Static Loss: $10.025 billion/year on $100 billion gains (50% foreign, 50% U.S., evenly split across U.S. holding periods).
Trump’s Tariff Assumption
Per recent news (e.g., April 2025 reports), Trump’s tariffs-e.g., 10% baseline, 34% on China, 20% on the EU-aim to protect U.S. industries, repatriate manufacturing, and raise revenue. Assuming he’s right:
-
Economic Prosperity: Tariffs shift production to the U.S., increasing domestic corporate profits and stock values, amplifying capital gains realizations.
-
Investment Surge: Lower U.S. capital gains rates (7.5% to 0%) combined with tariff protection incentivize massive reinvestment in U.S. firms.
-
Revenue Offset: Tariffs generate significant federal revenue (e.g., $100 billion/year from auto tariffs alone, per some estimates), reducing the net fiscal cost of tax cuts.
-
Increased Domestic Investment:
-
Foreign-to-U.S. Shift: Tariffs make foreign goods costlier, driving 30% of $50 billion foreign gains ($15 billion) to U.S. stocks over 5 years (6% annually, $3 billion/year), vs. 20% without tariffs.
-
New Investment: Tariff protection and low rates boost U.S. investment by 20% ($10 billion/year new gains) vs. 10% previously, as firms reinvest tariff-shielded profits.
-
-
Holding Period Shift:
-
Investors favor long-term U.S. holds for 0% rate, shifting to 15% (2 yrs), 15% (4 yrs), 25% (7 yrs), 45% (12 yrs) by year 5, reflecting confidence in tariff-sustained growth.
-
-
Economic Growth:
-
Tariffs and tax cuts together yield 0.5% annual GDP growth ($100 billion on $20 trillion GDP) vs. 0.3%, with 20% ($20 billion) taxable at 25% ($5 billion revenue), reflecting manufacturing revival and consumer spending.
-
-
Revenue Feedback:
-
Elasticity: Rate cuts (20% to 7.5%-0%) plus tariff protection increase U.S. gains by 15% ($7.5 billion on $50 billion) vs. 11.375%, as investors rush to U.S. equities.
-
Tariff Revenue: Assume $50 billion/year (half the $100 billion auto estimate), directly offsetting capital gains losses.
-
Revised Revenue Calculation
Year 1 (Initial Impact)
-
Baseline Gains: $100 billion ($50B foreign, $50B U.S.).
-
Static Loss: $10.025 billion.
-
Dynamic Adjustments:
-
Foreign-to-U.S. Shift: $3B × 3.125% (avg. U.S. rate) = $93.75M vs. $564M (18.8%). Loss: $470.25M.
-
New U.S. Gains: $10B × 3.125% = $312.5M revenue.
-
Elasticity Boost: $7.5B × 3.125% = $234.375M revenue.
-
GDP Feedback: $5B revenue.
-
Tariff Revenue: $50B.
-
-
Total Revenue:
-
Static: $11.275B.
-
Dynamic Add-ons: $312.5M + $234.375M + $5B = $5.546875B.
-
Tariffs: $50B.
-
New Total: $11.275B + $5.546875B + $50B = $66.821875 billion.
-
-
Revised Impact: $21.3B – $66.821875B = +$45.521875 billion surplus.
-
Adjusted Gains:
-
Foreign: $35B (after $15B shift).
-
U.S.: $75B ($50B + $15B shift + $10B new).
-
U.S. Split: 15% ($11.25B) at 7.5%, 15% ($11.25B) at 5%, 25% ($18.75B) at 2.5%, 45% ($33.75B) at 0%.
-
-
Revenue:
-
Foreign: $35B × 18.8% = $6.58B.
-
U.S.:
-
$11.25B × 7.5% = $0.84375B.
-
$11.25B × 5% = $0.5625B.
-
$18.75B × 2.5% = $0.46875B.
-
$33.75B × 0% = $0.
-
-
Total U.S.: $1.875B.
-
GDP Feedback: $5B.
-
Tariffs: $50B.
-
-
Total Revenue: $6.58B + $1.875B + $5B + $50B = $63.455B.
-
Revised Impact: $21.3B – $63.455B = +$42.155 billion surplus.
-
Trend: Surplus grows from $45.522B (Year 1) to $42.155B (Year 5), stabilizing as tariff and growth effects mature. Average ~$43.5B/year surplus.
-
10-Year Total: $43.5B × 10 = $435 billion surplus.
-
Annual Impact: +$43.5 billion surplus (vs. $10.025B static loss, $7.5B dynamic loss without tariff boost).
-
5-Year: +$217.5 billion.
-
10-Year: +$435 billion.
-
Shift: From $100.25B loss (static) to $435B gain, a $535.25B swing.
-
Tariff Synergy: Assuming Trump’s tariffs work as claimed, the $50B/year revenue dwarfs the capital gains loss, turning a deficit into a surplus. This aligns with his claim of tariffs as a revenue tool (e.g., $100B from autos per some reports).
-
Investment Boom: $15B shift + $10B new gains ($25B total increase) reflect tariff-driven U.S. stock preference, amplified by 0% long-term rates, supporting his “prosperity” narrative.
-
Growth: 0.5% GDP uplift ($5B tax revenue) backs the “strengthen American companies” assertion, with manufacturing gains boosting wages and consumption.
-
PAYGO: No offsets needed; the policy pays for itself and more, fitting Trump’s economic independence vision.
-
Tariff Revenue: $50B is conservative (half of some estimates); $100B would double the surplus to ~$90B/year. Retaliation or trade war losses could cut this, but Trump’s assumption implies U.S. leverage prevails.
-
Growth: 0.5% GDP assumes moderate success; 1% (e.g., from full manufacturing revival) could add $10B+ in annual revenue.
-
Behavior: Heavy 0% holds (45%) assume investor confidence in tariff stability-volatility could skew this.
Conclusion
If Trump is right about tariffs driving economic prosperity, the capital gains proposal doesn’t just mitigate its static $10B/year cost-it generates a $43.5B annual surplus, flipping the fiscal narrative. This hinges on tariffs delivering $50B+ in revenue and sparking a $25B+ U.S. investment surge, consistent with his claims of revitalizing the economy.
Testing for Higher Tariff Revenue or GDP Growth Scenarios
Let’s refine the dynamic scoring of the proposed capital gains tax structure, incorporating your request to test both higher tariff revenue and higher GDP growth, under the assumption that Trump’s claims about tariffs driving economic prosperity are correct. We’ll adjust the previous model to reflect an even more optimistic scenario-higher tariff revenue (beyond the prior $50 billion/year) and a stronger GDP growth rate-while maintaining the proposed capital gains rates and assessing their fiscal impact over a 10-year horizon.
Proposed Capital Gains Structure Recap
-
Foreign/Non-qualifying: 15% (> $75,000); NIIT 3.8% (> $200,000).
-
Domestic U.S.:
-
7.5% (1-3 years), 5% (3-5 years), 2.5% (5-10 years), 0% (10+ years).
-
NIIT: 0% for U.S. gains.
-
-
Static Loss: $10.025 billion/year on $100 billion gains (50% foreign, 50% U.S., evenly split across U.S. holding periods).
Trump’s Tariff Assumption (Enhanced)
Trump asserts tariffs will restore U.S. prosperity, implying robust economic growth and substantial revenue. Let’s test:
-
Higher Tariff Revenue: Increase from $50 billion/year to $100 billion/year, aligning with estimates like Navarro’s $700 billion/year (CNN, March 2025) or auto tariff projections ($100 billion/year, White House, February 2025). This assumes tariffs on Canada, Mexico, China (25%, 34%, etc.) fully succeed without significant retaliation losses.
-
Higher GDP Growth: Boost from 0.5% to 1% annual GDP growth ($200 billion on a $20 trillion GDP base), reflecting a manufacturing renaissance, increased consumer spending, and investment spurred by tariffs and low U.S. capital gains rates.
Dynamic Scoring Assumptions (Optimized)
Increased Domestic Investment:
-
-
Foreign-to-U.S. Shift: 40% of $50 billion foreign gains ($20 billion) shifts to U.S. stocks over 5 years (8% annually, $4 billion/year), vs. 30% previously, as tariffs make foreign assets less attractive.
-
New Investment: 30% increase in U.S. gains ($15 billion/year) vs. 20%, driven by tariff protection and 0% long-term rates unlocking capital.
-
-
Holding Period Shift:
-
Investors heavily favor 0% rate: 10% (2 yrs), 10% (4 yrs), 20% (7 yrs), 60% (12 yrs) by year 5, vs. 45%, as tariff-driven U.S. stock growth boosts long-term confidence.
-
-
Economic Growth:
-
1% GDP growth ($200 billion/year), with 20% ($40 billion) taxable at 25% ($10 billion revenue), vs. $5 billion previously, reflecting a tariff-fueled boom.
-
-
Revenue Feedback:
-
Elasticity: 20% increase in U.S. gains ($10 billion on $50 billion) vs. 15%, as lower rates (20% to 0%) and tariff incentives supercharge realizations.
-
Tariff Revenue: $100 billion/year, doubling the prior estimate, assuming Trump’s leverage maximizes collections.
-
Revised Revenue Calculation
Year 1 (Initial Impact)
-
Baseline Gains: $100 billion ($50B foreign, $50B U.S.).
-
Static Loss: $10.025 billion.
-
Dynamic Adjustments:
-
Foreign-to-U.S. Shift: $4B × 3.125% = $125M vs. $752M (18.8%). Loss: $627M.
-
New U.S. Gains: $15B × 3.125% = $468.75M.
-
Elasticity Boost: $10B × 3.125% = $312.5M.
-
GDP Feedback: $10B.
-
Tariff Revenue: $100B.
-
-
Total Revenue:
-
Static: $11.275B.
-
Dynamic Add-ons: $468.75M + $312.5M + $10B = $10.78125B.
-
Tariffs: $100B.
-
New Total: $11.275B + $10.78125B + $100B = $122.05625 billion.
-
-
Revised Impact: $21.3B – $122.05625B = +$100.75625 billion surplus.
-
Adjusted Gains:
-
Foreign: $30B (after $20B shift).
-
U.S.: $85B ($50B + $20B shift + $15B new).
-
U.S. Split: 10% ($8.5B) at 7.5%, 10% ($8.5B) at 5%, 20% ($17B) at 2.5%, 60% ($51B) at 0%.
-
-
Revenue:
-
Foreign: $30B × 18.8% = $5.64B.
-
U.S.:
-
$8.5B × 7.5% = $0.6375B.
-
$8.5B × 5% = $0.425B.
-
$17B × 2.5% = $0.425B.
-
$51B × 0% = $0.
-
-
Total U.S.: $1.4875B.
-
GDP Feedback: $10B.
-
Tariffs: $100B.
-
-
Total Revenue: $5.64B + $1.4875B + $10B + $100B = $117.1275 billion.
-
Revised Impact: $21.3B – $117.1275B = +$95.8275 billion surplus.
-
Trend: Surplus declines slightly from $100.756B (Year 1) to $95.8275B (Year 5) as 0% holds dominate, then stabilizes. Average ~$97.5 billion/year surplus.
-
10-Year Total: $97.5B × 10 = $975 billion surplus.
-
Annual Impact: +$97.5 billion surplus (vs. $10.025B static loss, $43.5B surplus with $50B tariffs).
-
5-Year: +$487.5 billion.
-
10-Year: +$975 billion.
-
Shift: From $100.25B static loss to $975B gain, a $1.075 trillion swing.
-
Tariff Revenue: Doubling to $100 billion/year (e.g., Navarro’s $700B/10 years implies $70B/year; we exceed this) turns the policy into a massive revenue generator, dwarfing the $10B capital gains loss.
-
GDP Growth: 1% ($200B/year) adds $10B in tax revenue, reflecting a tariff-driven boom in manufacturing, wages, and consumption-far exceeding the 0.5% ($5B) case.
-
Investment Surge: $20B shift + $15B new gains ($35B total) and 20% elasticity boost ($10B) show a tariff-and-tax synergy, with 60% of U.S. gains at 0% by year 5 amplifying retention.
-
PAYGO: A $975B surplus eliminates offset needs, funding tax cuts or spending (e.g., $5T TCJA extension becomes feasible).
-
Static: $10.025B/year loss ignores growth.
-
Prior Dynamic ($50B tariffs, 0.5% GDP): $43.5B/year surplus.
-
New Dynamic ($100B tariffs, 1% GDP): $97.5B/year surplus-over doubles the fiscal benefit, aligning with Trump’s “rich again” claim.
-
Tariff Success: $100B assumes no major retaliation or trade war erosion (e.g., China’s 34% counter-tariffs, April 2025, could cut this if escalated).
-
Growth Ceiling: 1% GDP is optimistic; OECD (March 2025) predicts 2.2% U.S. growth with tariffs dragging it down-1% net growth implies tariffs add ~0.8% above baseline, plausible but aggressive.
-
Market Risk: Heavy 0% holds (60%) could lock capital, reducing short-term liquidity if confidence falters.
Pushing for a Bolder Test
Let’s push the dynamic scoring of the proposed capital gains tax structure to an even bolder scenario, testing higher tariff revenue at $150 billion/year and GDP growth at 1.5% annually. This assumes an extremely optimistic outcome where Trump’s tariff policies not only succeed as he claims-strengthening the U.S. economy and driving prosperity-but exceed expectations, maximizing revenue and economic expansion. We’ll adjust the prior model and calculate the fiscal impact over 10 years.
Proposed Capital Gains Structure Recap
-
Foreign/Non-qualifying: 15% (> $75,000); NIIT 3.8% (> $200,000).
-
Domestic U.S.:
-
7.5% (1-3 years), 5% (3-5 years), 2.5% (5-10 years), 0% (10+ years).
-
NIIT: 0% for U.S. gains.
-
-
Static Loss: $10.025 billion/year on $100 billion gains (50% foreign, 50% U.S., evenly split across U.S. holding periods).
-
Higher Tariff Revenue: $150 billion/year, surpassing prior estimates (e.g., $100 billion from autos, White House, February 2025; Navarro’s $700 billion/10 years = $70B/year, CNN, March 2025). This assumes tariffs (10% baseline, 34% China, 20% EU, etc.) fully optimize collections, with minimal retaliation or trade disruption.
-
Higher GDP Growth: 1.5% annually ($300 billion on a $20 trillion GDP base), reflecting a tariff-driven manufacturing boom, massive domestic investment, and consumer spending surge, fueled by low U.S. capital gains rates.
-
Increased Domestic Investment:
-
Foreign-to-U.S. Shift: 50% of $50 billion foreign gains ($25 billion) shifts to U.S. stocks over 5 years (10% annually, $5 billion/year), vs. 40%, as tariffs heavily penalize foreign markets.
-
New Investment: 40% increase in U.S. gains ($20 billion/year) vs. 30%, with tariff protection and 0% rates unlocking unprecedented capital flows.
-
-
Holding Period Shift:
-
Investors overwhelmingly favor 0% rate: 5% (2 yrs), 5% (4 yrs), 15% (7 yrs), 75% (12 yrs) by year 5, vs. 60%, as tariff-sustained U.S. stock growth locks in long-term bets.
-
-
Economic Growth:
-
1.5% GDP growth ($300 billion/year), with 20% ($60 billion) taxable at 25% ($15 billion revenue), vs. $10 billion, reflecting a tariff-and-tax-fueled economic renaissance.
-
-
Revenue Feedback:
-
Elasticity: 25% increase in U.S. gains ($12.5 billion on $50 billion) vs. 20%, as rates dropping from 20% to 0% plus tariff incentives turbocharge realizations.
-
Tariff Revenue: $150 billion/year, assuming Trump’s leverage extracts maximum yield from global trade partners.
-
Revised Revenue Calculation
Year 1 (Initial Impact)
-
Baseline Gains: $100 billion ($50B foreign, $50B U.S.).
-
Static Loss: $10.025 billion.
-
Dynamic Adjustments:
-
Foreign-to-U.S. Shift: $5B × 3.125% = $156.25M vs. $940M (18.8%). Loss: $783.75M.
-
New U.S. Gains: $20B × 3.125% = $625M.
-
Elasticity Boost: $12.5B × 3.125% = $390.625M.
-
GDP Feedback: $15B.
-
Tariff Revenue: $150B.
-
-
Total Revenue:
-
Static: $11.275B.
-
Dynamic Add-ons: $625M + $390.625M + $15B = $16.015625B.
-
Tariffs: $150B.
-
New Total: $11.275B + $16.015625B + $150B = $177.290625 billion.
-
-
Revised Impact: $21.3B – $177.290625B = +$155.990625 billion surplus.
-
Adjusted Gains:
-
Foreign: $25B (after $25B shift).
-
U.S.: $95B ($50B + $25B shift + $20B new).
-
U.S. Split: 5% ($4.75B) at 7.5%, 5% ($4.75B) at 5%, 15% ($14.25B) at 2.5%, 75% ($71.25B) at 0%.
-
-
Revenue:
-
Foreign: $25B × 18.8% = $4.7B.
-
U.S.:
-
$4.75B × 7.5% = $0.35625B.
-
$4.75B × 5% = $0.2375B.
-
$14.25B × 2.5% = $0.35625B.
-
$71.25B × 0% = $0.
-
-
Total U.S.: $0.95B.
-
GDP Feedback: $15B.
-
Tariffs: $150B.
-
-
Total Revenue: $4.7B + $0.95B + $15B + $150B = $170.65 billion.
-
Revised Impact: $21.3B – $170.65B = +$149.35 billion surplus.
-
Trend: Surplus dips from $155.991B (Year 1) to $149.35B (Year 5) as 0% holds dominate, then stabilizes. Average ~$152 billion/year surplus.
-
10-Year Total: $152B × 10 = $1.52 trillion surplus.
-
Annual Impact: +$152 billion surplus (vs. $10.025B static loss, $97.5B surplus with $100B tariffs/1% GDP).
-
5-Year: +$760 billion.
-
10-Year: +$1.52 trillion.
-
Shift: From $100.25B static loss to $1.52T gain, a $1.62 trillion swing.
-
Tariff Revenue: $150B/year (e.g., exceeding Navarro’s $70B/year average or auto-specific $100B) overwhelms the static $10B loss, turning the policy into a fiscal windfall-supporting Trump’s “tariffs make us rich” claim.
-
GDP Growth: 1.5% ($300B/year) adds $15B in tax revenue, reflecting a tariff-and-tax-driven boom that triples the prior $5B feedback, aligning with a vision of unmatched prosperity.
-
Investment Surge: $25B shift + $20B new gains ($45B total) and 25% elasticity ($12.5B) show a capital flood into U.S. stocks, with 75% at 0% by year 5 maximizing retention.
-
PAYGO: A $1.52T surplus obliterates offset needs, potentially funding massive tax cuts (e.g., $5T TCJA) or infrastructure, fulfilling Trump’s economic promises.
-
Static: $10.025B/year loss.
-
Prior Dynamic ($100B tariffs, 1% GDP): $97.5B/year surplus.
-
Bolder Dynamic ($150B tariffs, 1.5% GDP): $152B/year surplus-56% higher than the prior dynamic case, reflecting extreme tariff success.
-
Tariff Feasibility: $150B/year assumes near-perfect execution (e.g., $1.5T over 10 years vs. Navarro’s $700B), requiring no significant trade war drag-bold even for Trump’s optimism.
-
Growth Limit: 1.5% net GDP growth exceeds OECD’s 2.2% baseline (March 2025) minus tariff costs; it implies tariffs add ~1.3% above trend, possible with manufacturing dominance but vulnerable to global pushback.
-
Market Dynamics: 75% at 0% holds could strain liquidity if economic shocks hit, though tariff revenue cushions this.
The Ultimate Stress Test
Let’s conduct the ultimate stress test of the proposed capital gains tax structure under dynamic scoring, pushing the boundaries to their maximum plausible extent. We’ll assume an extraordinarily optimistic scenario where tariff revenue reaches $200 billion/year and GDP growth hits 2% annually, reflecting a near-perfect realization of Trump’s claims that tariffs will supercharge the U.S. economy, drive unprecedented domestic investment, and restore prosperity on an epic scale. This will stretch economic assumptions to their limits while calculating the fiscal impact over 10 years.
Proposed Capital Gains Structure Recap
-
Foreign/Non-qualifying: 15% (> $75,000); NIIT 3.8% (> $200,000).
-
Domestic U.S.:
-
7.5% (1-3 years), 5% (3-5 years), 2.5% (5-10 years), 0% (10+ years).
-
NIIT: 0% for U.S. gains.
-
-
Static Loss: $10.025 billion/year on $100 billion gains (50% foreign, 50% U.S., evenly split across U.S. holding periods).
-
Tariff Revenue: $200 billion/year, exceeding prior estimates (e.g., $100B from autos, White House, February 2025; Navarro’s $700B/10 years = $70B/year, CNN, March 2025). This assumes tariffs (e.g., 10% baseline, 34%+ on China, 20%+ on others) achieve maximum yield, with negligible retaliation or trade disruption-Trump’s leverage at its peak.
-
GDP Growth: 2% annually ($400 billion on a $20 trillion GDP base), reflecting a tariff-and-tax-driven economic miracle: manufacturing dominance, full employment, and soaring consumer/investment activity.
-
Increased Domestic Investment:
-
Foreign-to-U.S. Shift: 60% of $50 billion foreign gains ($30 billion) shifts to U.S. stocks over 5 years (12% annually, $6 billion/year), vs. 50%, as tariffs obliterate foreign competitiveness.
-
New Investment: 50% increase in U.S. gains ($25 billion/year) vs. 40%, with 0% rates and tariff protection triggering a historic capital rush.
-
-
Holding Period Shift:
-
Investors fully commit to 0% rate: 5% (2 yrs), 5% (4 yrs), 10% (7 yrs), 80% (12 yrs) by year 5, vs. 75%, betting on tariff-sustained U.S. stock supremacy.
-
-
Economic Growth:
-
2% GDP growth ($400 billion/year), with 20% ($80 billion) taxable at 25% ($20 billion revenue), vs. $15 billion, reflecting an economic boom of unprecedented scale.
-
-
Revenue Feedback:
-
Elasticity: 30% increase in U.S. gains ($15 billion on $50 billion) vs. 25%, as rates dropping from 20% to 0% plus tariff incentives ignite explosive realizations.
-
Tariff Revenue: $200 billion/year, assuming Trump’s tariff regime extracts every possible dollar from global trade.
-
Revised Revenue Calculation
Year 1 (Initial Impact)
-
Baseline Gains: $100 billion ($50B foreign, $50B U.S.).
-
Static Loss: $10.025 billion.
-
Dynamic Adjustments:
-
Foreign-to-U.S. Shift: $6B × 3.125% = $187.5M vs. $1.128B (18.8%). Loss: $940.5M.
-
New U.S. Gains: $25B × 3.125% = $781.25M.
-
Elasticity Boost: $15B × 3.125% = $468.75M.
-
GDP Feedback: $20B.
-
Tariff Revenue: $200B.
-
-
Total Revenue:
-
Static: $11.275B.
-
Dynamic Add-ons: $781.25M + $468.75M + $20B = $21.25B.
-
Tariffs: $200B.
-
New Total: $11.275B + $21.25B + $200B = $232.525 billion.
-
-
Revised Impact: $21.3B – $232.525B = +$211.225 billion surplus.
-
Adjusted Gains:
-
Foreign: $20B (after $30B shift).
-
U.S.: $105B ($50B + $30B shift + $25B new).
-
U.S. Split: 5% ($5.25B) at 7.5%, 5% ($5.25B) at 5%, 10% ($10.5B) at 2.5%, 80% ($84B) at 0%.
-
-
Revenue:
-
Foreign: $20B × 18.8% = $3.76B.
-
U.S.:
-
$5.25B × 7.5% = $0.39375B.
-
$5.25B × 5% = $0.2625B.
-
$10.5B × 2.5% = $0.2625B.
-
$84B × 0% = $0.
-
-
Total U.S.: $0.91875B.
-
GDP Feedback: $20B.
-
Tariffs: $200B.
-
-
Total Revenue: $3.76B + $0.91875B + $20B + $200B = $224.67875 billion.
-
Revised Impact: $21.3B – $224.67875B = +$203.37875 billion surplus.
-
Trend: Surplus declines from $211.225B (Year 1) to $203.379B (Year 5) as 0% holds peak, then stabilizes. Average ~$207 billion/year surplus.
-
10-Year Total: $207B × 10 = $2.07 trillion surplus.
-
Annual Impact: +$207 billion surplus (vs. $10.025B static loss, $152B surplus with $150B tariffs/1.5% GDP).
-
5-Year: +$1.035 trillion.
-
10-Year: +$2.07 trillion.
-
Shift: From $100.25B static loss to $2.07T gain, a $2.17 trillion swing.
-
Tariff Revenue: $200B/year (e.g., doubling Navarro’s $700B/10-year projection) obliterates the $10B static loss, creating a fiscal bonanza-Trump’s “tariffs make us rich” on steroids.
-
GDP Growth: 2% ($400B/year) adds $20B in tax revenue, quadrupling the prior $5B feedback, painting a picture of an economic golden age driven by tariffs and tax cuts.
-
Investment Surge: $30B shift + $25B new gains ($55B total) and 30% elasticity ($15B) reflect a capital tsunami into U.S. stocks, with 80% at 0% by year 5 maximizing investor retention.
-
PAYGO: A $2.07T surplus could fund transformative policies-e.g., $5T TCJA extension, infrastructure, or debt reduction-embodying Trump’s prosperity vision at its boldest.
-
Static: $10.025B/year loss.
-
Prior Dynamic ($150B tariffs, 1.5% GDP): $152B/year surplus.
-
Ultimate Dynamic ($200B tariffs, 2% GDP): $207B/year surplus-36% higher than the prior bold case, a $55B/year jump.
-
Tariff Ceiling: $200B/year ($2T/10 years) assumes unrealistically smooth execution-e.g., no trade war escalation (China’s 34% counter-tariffs, April 2025) or supply chain collapse. Real-world friction might cap this at $150B-$180B.
-
Growth Limit: 2% net GDP growth exceeds OECD’s 2.2% baseline (March 2025) by ~1.8% above trend, implying tariffs alone add ~1.8%-possible only with global economic dominance and minimal retaliation.
-
Market Risk: 80% at 0% holds could freeze liquidity, risking volatility if tariff gains falter; $200B cushions this but assumes unbroken investor faith.
Assuming an Ongoing Market Selloff
Let’s assume the market selloff triggered by Trump’s tariff announcement on Tuesday, April 2, 2025, persists through the week and exerts short-term recessionary pressure on the U.S. economy, as suggested by the context of recent market reactions (e.g., S&P 500 dropping 4.8% on April 3, per Reuters). We’ll integrate this into the dynamic scoring of the proposed capital gains tax structure from the ultimate stress test ($200B tariffs, 2% GDP growth), adjusting for a recessionary downturn while maintaining the assumption that Trump’s broader tariff vision holds over the long term. This will test the fiscal impact under a severe short-term shock followed by a potential recovery, reflecting both immediate losses and dynamic feedback.
Proposed Capital Gains Structure Recap
-
Foreign/Non-qualifying: 15% (> $75,000); NIIT 3.8% (> $200,000).
-
Domestic U.S.:
-
7.5% (1-3 years), 5% (3-5 years), 2.5% (5-10 years), 0% (10+ years).
-
NIIT: 0% for U.S. gains.
-
-
Static Loss: $10.025 billion/year on $100 billion gains.
Recessionary Scenario Assumptions
Given the selloff’s continuation (e.g., Dow down 1,679 points on April 3, per ABC News; $4 trillion lost in two days, per Reuters), assume:
-
Short-Term Economic Shock (2025):
-
GDP Contraction: Instead of 2% growth, a 1% GDP decline (-$200 billion on $20 trillion base) in year 1, reflecting recessionary pressure (e.g., Goldman Sachs’ 35% recession odds, Reuters, March 31).
-
Capital Gains Drop: Total gains fall 20% ($100B to $80B) due to market panic and reduced realizations, with U.S. gains hit harder (50% to 40B).
-
Tariff Revenue: $200B holds, but economic drag cuts its net benefit as consumption and imports shrink.
-
-
Dynamic Adjustments Post-Recession:
-
Years 2-5 Recovery: GDP rebounds to 1.5% growth ($300B/year) by year 2, stabilizing at 2% by year 5, as tariff-driven investment kicks in.
-
Investment Shift: 60% foreign-to-U.S. shift ($30B over 5 years, $6B/year) delayed to year 2 start; new U.S. gains rise to $25B/year by year 3.
-
Holding Shift: Recession accelerates 0% preference-5% (2 yrs), 5% (4 yrs), 10% (7 yrs), 80% (12 yrs) by year 3, not 5.
-
Elasticity: 30% U.S. gains boost ($12B on $40B in year 1, rising post-recession).
-
Revised Revenue Calculation
Year 1 (Recessionary Shock)
-
Adjusted Gains: $80B ($40B foreign, $40B U.S.).
-
Revenue:
-
Foreign: $40B × 18.8% = $7.52B.
-
U.S. (assume pre-shift split: 25% each tier):
-
$10B × 7.5% = $0.75B.
-
$10B × 5% = $0.5B.
-
$10B × 2.5% = $0.25B.
-
$10B × 0% = $0.
-
-
Total U.S.: $1.5B.
-
GDP Feedback: -$200B × 20% × 25% = -$10B (revenue loss).
-
Tariffs: $200B.
-
-
Total Revenue: $7.52B + $1.5B – $10B + $200B = $199.02 billion.
-
Baseline (Current Law): $80B × 21.3% (avg. rate) = $17.04B.
-
Revised Impact: $17.04B – $199.02B = +$181.98 billion surplus.
-
Adjusted Gains: $115B ($40B foreign, $75B U.S. with $12B shift + $23B new/elasticity).
-
U.S. Split: 5% ($3.75B) at 7.5%, 5% ($3.75B) at 5%, 10% ($7.5B) at 2.5%, 80% ($60B) at 0%.
-
Revenue:
-
Foreign: $40B × 18.8% = $7.52B.
-
U.S.:
-
$3.75B × 7.5% = $0.28125B.
-
$3.75B × 5% = $0.1875B.
-
$7.5B × 2.5% = $0.1875B.
-
$60B × 0% = $0.
-
-
Total U.S.: $0.65625B.
-
GDP Feedback: $300B × 20% × 25% = $15B.
-
Tariffs: $200B.
-
-
Total Revenue: $7.52B + $0.65625B + $15B + $200B = $223.17625 billion.
-
Baseline: $115B × 21.3% = $24.495B.
-
Revised Impact: $24.495B – $223.17625B = +$198.68125 billion surplus.
-
Adjusted Gains: $120B ($35B foreign, $85B U.S. with $15B shift + $20B new).
-
U.S. Split: As above, scaled to $85B.
-
Revenue: $5.64B (foreign) + $0.765B (U.S.) + $20B (2% GDP) + $200B = $226.405B.
-
Baseline: $25.56B.
-
Revised Impact: +$200.845 billion surplus.
-
Year 1: +$181.98B.
-
Years 2-5: Average ~$200B/year (rising from $198.681B).
-
Years 6-10: ~$205B/year (2% GDP sustained).
-
Average: ~$200 billion/year surplus.
-
10-Year Total: $2 trillion surplus.
-
Recessionary Hit: Year 1’s 1% GDP drop and 20% gains reduction cut revenue by $30B vs. the prior $211B surplus, but $200B tariffs still yield a $181.98B surplus-resilient even in crisis.
-
Recovery: By year 3, 1.5%-2% GDP growth and investment surges restore momentum, pushing surpluses above $200B/year, with 80% at 0% amplifying U.S. stock appeal.
-
Tariff Dominance: $200B/year overshadows the $10B static loss, making the policy a net fiscal winner despite short-term pain.
-
PAYGO: $2T surplus funds massive initiatives, even with a recession, aligning with Trump’s vision if tariffs hold.
-
Static: $10.025B/year loss.
-
Prior Ultimate ($200B tariffs, 2% GDP, no recession): $207B/year surplus.
-
Stress Test with Recession: $200B/year surplus-resilient, only $7B/year less.
-
Recession Depth: A 2% GDP drop or 40% gains fall could halve year 1 surplus to ~$90B, testing tariff reliance.
-
Tariff Reality: $200B assumes no trade war collapse-e.g., China’s 34% retaliation (Reuters, April 4) could erode $50B-$100B if escalated.
-
Growth Cap: 2% net GDP implies ~2% tariff-driven boost over a 0% baseline, heroic against OECD’s 2.2% minus trade drag.
Deepened Recession and Reduced Tariff Revenue
Let’s perform a reality check on the dynamic scoring of the proposed capital gains tax structure by deepening the recessionary impact and reducing tariff revenue, reflecting a more grounded scenario while still assuming Trump’s broader tariff vision holds over the long term. We’ll adjust the ultimate stress test ($200B tariffs, 2% GDP growth) to account for a sharper short-term downturn and lower tariff yield, balancing optimism with plausible economic friction.
Proposed Capital Gains Structure Recap
Foreign/Non-qualifying: 15% (> $75,000); NIIT 3.8% (> $200,000).
-
Domestic U.S.:
-
7.5% (1-3 years), 5% (3-5 years), 2.5% (5-10 years), 0% (10+ years).
-
NIIT: 0% for U.S. gains.
-
-
Static Loss: $10.025 billion/year on $100 billion gains.
Reality Check Assumptions
Given this week’s market selloff (e.g., S&P 500 -4.8% on April 3, Reuters; $4T lost in two days), let’s deepen the recession and cut tariffs:
-
Deepened Recession (2025):
-
GDP Contraction: 2% decline (-$400 billion on $20 trillion base) in year 1, vs. 1%, aligning with severe market panic (e.g., Goldman Sachs’ 35% recession odds doubling to 70% post-selloff).
-
Capital Gains Drop: 40% reduction ($100B to $60B), vs. 20%, as investors freeze realizations amid uncertainty.
-
U.S. Share: Falls to 50% ($30B) initially, reflecting global selloff parity.
-
-
Tariff Revenue Reduction:
-
Cut to $180 billion/year, vs. $200B, factoring in trade war retaliation (e.g., China’s 34% counter-tariffs, Reuters, April 4) and reduced import volumes in a recession.
-
-
Dynamic Recovery (Years 2-10):
-
GDP: Rebounds to 1% growth ($200B/year) in year 2, reaching 1.5% ($300B/year) by year 5, vs. 2%, as tariff benefits emerge more slowly.
-
Investment Shift: 60% foreign-to-U.S. shift ($30B over 5 years, $6B/year) starts year 2; new U.S. gains hit $20B/year by year 3, vs. $25B.
-
Holding Shift: 5% (2 yrs), 5% (4 yrs), 10% (7 yrs), 80% (12 yrs) by year 4, vs. year 3, delayed by recession fears.
-
Elasticity: 25% U.S. gains boost ($7.5B on $30B in year 1, rising post-recession).
-
Revised Revenue Calculation
Year 1 (Deep Recession)
-
Adjusted Gains: $60B ($30B foreign, $30B U.S.).
-
Revenue:
-
Foreign: $30B × 18.8% = $5.64B.
-
U.S. (25% each tier):
-
$7.5B × 7.5% = $0.5625B.
-
$7.5B × 5% = $0.375B.
-
$7.5B × 2.5% = $0.1875B.
-
$7.5B × 0% = $0.
-
-
Total U.S.: $1.125B.
-
GDP Feedback: -$400B × 20% × 25% = -$20B (revenue loss).
-
Tariffs: $180B.
-
-
Total Revenue: $5.64B + $1.125B – $20B + $180B = $166.765 billion.
-
Baseline (Current Law): $60B × 21.3% = $12.78B.
-
Revised Impact: $12.78B – $166.765B = +$154.985 billion surplus.
-
Adjusted Gains: $105B ($40B foreign, $65B U.S. with $12B shift + $13B new/elasticity).
-
U.S. Split: 5% ($3.25B) at 7.5%, 5% ($3.25B) at 5%, 10% ($6.5B) at 2.5%, 80% ($52B) at 0%.
-
Revenue:
-
Foreign: $40B × 18.8% = $7.52B.
-
U.S.:
-
$3.25B × 7.5% = $0.24375B.
-
$3.25B × 5% = $0.1625B.
-
$6.5B × 2.5% = $0.1625B.
-
$52B × 0% = $0.
-
-
Total U.S.: $0.56875B.
-
GDP Feedback: $200B × 20% × 25% = $10B.
-
Tariffs: $180B.
-
-
Total Revenue: $7.52B + $0.56875B + $10B + $180B = $198.08875 billion.
-
Baseline: $105B × 21.3% = $22.365B.
-
Revised Impact: $22.365B – $198.08875B = +$175.72375 billion surplus.
-
Adjusted Gains: $110B ($35B foreign, $75B U.S. with $15B shift + $10B new).
-
Revenue:
-
Foreign: $35B × 18.8% = $6.58B.
-
U.S.: $0.65625B (scaled from year 3).
-
GDP Feedback: $300B × 20% × 25% = $15B.
-
Tariffs: $180B.
-
-
Total Revenue: $6.58B + $0.65625B + $15B + $180B = $202.23625 billion.
-
Baseline: $23.43B.
-
Revised Impact: +$178.80625 billion surplus.
-
Year 1: +$154.985B.
-
Years 2-5: ~$175B/year (rising to $178.806B).
-
Years 6-10: ~$182B/year (1.5% GDP sustained).
-
Average: ~$177 billion/year surplus.
-
10-Year Total: $1.77 trillion surplus.
-
Deep Recession: Year 1’s 2% GDP drop and 40% gains fall slash revenue by ~$56B vs. the prior $211B surplus, but $180B tariffs keep a $154.985B surplus-resilient despite the plunge.
-
Slower Recovery: 1%-1.5% GDP growth and delayed investment ($20B vs. $25B new gains) temper the rebound, stabilizing at $178B-$182B surpluses by year 5.
-
Tariff Reality: $180B reflects trade war drag (e.g., $20B-$50B lost to retaliation), still dwarfing the $10B static loss.
-
PAYGO: $1.77T surplus funds significant policies, though $300B less than the $2.07T no-recession case, showing recessionary cost.
-
Static: $10.025B/year loss.
-
Prior Stress Test ($200B tariffs, 2% GDP, 1% recession): $200B/year surplus.
-
Reality Check ($180B tariffs, 1.5% GDP, 2% recession): $177B/year surplus-11.5% lower, a $23B/year hit.
-
Recession Severity: A 3% GDP drop or 50% gains fall could cut year 1 surplus to ~$130B, testing tariff reliance further.
-
Tariff Erosion: $180B assumes moderate retaliation; a full trade war (e.g., EU/China matching tariffs) might drop it to $150B, reducing surplus to ~$150B/year.
-
Growth Lag: 1.5% by year 5 vs. 2% reflects slower tariff uptake-OECD’s 2.2% baseline minus trade drag suggests ~1% net growth is more realistic long-term.
Tweaking Recession Depth
Let’s further tweak the dynamic scoring of the proposed capital gains tax structure for an even more conservative reality check, deepening the recession to a 3% GDP decline and reducing tariff revenue to $150 billion/year. This scenario assumes a severe short-term economic shock from the ongoing market selloff (triggered by Trump’s tariff announcement on April 2, 2025) and significant trade war retaliation, testing the limits of resilience while still holding to the long-term optimism of Trump’s tariff vision. We’ll adjust the prior reality check ($180B tariffs, 1.5% GDP post-recession) and calculate the fiscal impact over 10 years.
Proposed Capital Gains Structure Recap
Foreign/Non-qualifying: 15% (> $75,000); NIIT 3.8% (> $200,000).
-
Domestic U.S.:
-
7.5% (1-3 years), 5% (3-5 years), 2.5% (5-10 years), 0% (10+ years).
-
NIIT: 0% for U.S. gains.
-
-
Static Loss: $10.025 billion/year on $100 billion gains.
Adjusted Reality Check Assumptions
Building on the selloff (e.g., S&P 500 -4.8% April 3, Reuters; $4T lost in two days):
-
Severe Recession (2025):
-
GDP Contraction: 3% decline (-$600 billion on $20 trillion base) in year 1, vs. 2%, reflecting a deep downturn (e.g., Goldman Sachs’ recession odds hitting 80% post-selloff).
-
Capital Gains Drop: 50% reduction ($100B to $50B), vs. 40%, as investors halt realizations amid a crash.
-
U.S. Share: 50% ($25B) initially, with global markets equally battered.
-
-
Tariff Revenue Reduction:
-
Cut to $150 billion/year, vs. $180B, factoring in escalated retaliation (e.g., China’s 34% counter-tariffs, EU matching 20%, April 2025 reports) and a recession-driven import slump.
-
-
Dynamic Recovery (Years 2-10):
-
GDP: Rebounds to 0.5% growth ($100B/year) in year 2, reaching 1% ($200B/year) by year 5, vs. 1.5%, as tariff benefits emerge slowly amid global friction.
-
Investment Shift: 60% foreign-to-U.S. shift ($30B over 5 years, $6B/year) starts year 2; new U.S. gains hit $15B/year by year 3, vs. $20B, reflecting cautious recovery.
-
Holding Shift: 5% (2 yrs), 5% (4 yrs), 10% (7 yrs), 80% (12 yrs) by year 5, vs. year 4, further delayed by recession fallout.
-
Elasticity: 20% U.S. gains boost ($5B on $25B in year 1, rising post-recession), vs. 25%, tempered by uncertainty.
-
Revised Revenue Calculation
Year 1 (Severe Recession)
-
Adjusted Gains: $50B ($25B foreign, $25B U.S.).
-
Revenue:
-
Foreign: $25B × 18.8% = $4.7B.
-
U.S. (25% each tier):
-
$6.25B × 7.5% = $0.46875B.
-
$6.25B × 5% = $0.3125B.
-
$6.25B × 2.5% = $0.15625B.
-
$6.25B × 0% = $0.
-
-
Total U.S.: $0.9375B.
-
GDP Feedback: -$600B × 20% × 25% = -$30B (revenue loss).
-
Tariffs: $150B.
-
-
Total Revenue: $4.7B + $0.9375B – $30B + $150B = $125.6375 billion.
-
Baseline (Current Law): $50B × 21.3% = $10.65B.
-
Revised Impact: $10.65B – $125.6375B = +$114.9875 billion surplus.
-
Adjusted Gains: $95B ($40B foreign, $55B U.S. with $12B shift + $3B new/elasticity).
-
U.S. Split: 10% ($5.5B) at 7.5%, 10% ($5.5B) at 5%, 20% ($11B) at 2.5%, 60% ($33B) at 0%.
-
Revenue:
-
Foreign: $40B × 18.8% = $7.52B.
-
U.S.:
-
$5.5B × 7.5% = $0.4125B.
-
$5.5B × 5% = $0.275B.
-
$11B × 2.5% = $0.275B.
-
$33B × 0% = $0.
-
-
Total U.S.: $0.9625B.
-
GDP Feedback: $100B × 20% × 25% = $5B.
-
Tariffs: $150B.
-
-
Total Revenue: $7.52B + $0.9625B + $5B + $150B = $163.4825 billion.
-
Baseline: $95B × 21.3% = $20.235B.
-
Revised Impact: $20.235B – $163.4825B = +$143.2475 billion surplus.
-
Adjusted Gains: $100B ($35B foreign, $65B U.S. with $15B shift + $15B new).
-
U.S. Split: 5% ($3.25B) at 7.5%, 5% ($3.25B) at 5%, 10% ($6.5B) at 2.5%, 80% ($52B) at 0%.
-
Revenue:
-
Foreign: $35B × 18.8% = $6.58B.
-
U.S.: $0.56875B (scaled from prior).
-
GDP Feedback: $200B × 20% × 25% = $10B.
-
Tariffs: $150B.
-
-
Total Revenue: $6.58B + $0.56875B + $10B + $150B = $167.14875 billion.
-
Baseline: $21.3B.
-
Revised Impact: +$145.84875 billion surplus.
-
Year 1: +$114.9875B.
-
Years 2-5: ~$144B/year (rising to $145.84875B).
-
Years 6-10: ~$148B/year (1% GDP sustained).
-
Average: ~$144 billion/year surplus.
-
10-Year Total: $1.44 trillion surplus.
-
Severe Recession: Year 1’s 3% GDP drop and 50% gains collapse cut revenue by ~$86B vs. the prior $200B surplus, but $150B tariffs maintain a $114.99B surplus-still positive under extreme stress.
-
Gradual Recovery: 0.5%-1% GDP growth and slower investment ($15B vs. $20B new gains) limit rebound, stabilizing at $145B-$148B surpluses by year 5.
-
Tariff Realism: $150B reflects significant trade war losses (e.g., $50B-$80B eroded by retaliation), yet overshadows the $10B static loss.
-
PAYGO: $1.44T surplus remains substantial, though $330B less than the $1.77T prior case and $630B below the $2.07T ultimate test, showing recessionary drag.
-
Static: $10.025B/year loss.
-
Prior Reality Check ($180B tariffs, 1.5% GDP, 2% recession): $177B/year surplus.
-
New Reality Check ($150B tariffs, 1% GDP, 3% recession): $144B/year surplus-18.6% lower, a $33B/year hit.
-
Recession Depth: A 4% GDP drop or 60% gains fall could push year 1 surplus below $100B, testing tariff buoyancy.
-
Tariff Floor: $150B assumes heavy but survivable retaliation; a collapse to $120B (e.g., full trade war) might drop surplus to ~$115B/year.
-
Growth Constraint: 1% by year 5 aligns with OECD’s 2.2% baseline minus ~1.2% trade drag-realistic but assumes tariffs eventually offset recession losses.
An Even Harsher Test
Let’s perform an even harsher reality check on the dynamic scoring of the proposed capital gains tax structure, pushing the recession to a 4% GDP decline and reducing tariff revenue to $120 billion/year. This scenario assumes an extreme short-term economic collapse following the market selloff from Trump’s tariff announcement on April 2, 2025, coupled with a severe trade war backlash, testing the breaking point of the policy while still assuming Trump’s long-term tariff vision eventually delivers some recovery. We’ll adjust the prior reality check ($150B tariffs, 1% GDP post-recession) and calculate the fiscal impact over 10 years.
Proposed Capital Gains Structure Recap
-
Foreign/Non-qualifying: 15% (> $75,000); NIIT 3.8% (> $200,000).
-
Domestic U.S.:
-
7.5% (1-3 years), 5% (3-5 years), 2.5% (5-10 years), 0% (10+ years).
-
NIIT: 0% for U.S. gains.
-
-
Static Loss: $10.025 billion/year on $100 billion gains.
Harsher Test Assumptions
Given the selloff’s escalation (e.g., S&P 500 -4.8% April 3, Reuters; $4T lost in two days):
-
Extreme Recession (2025):
-
GDP Contraction: 4% decline (-$800 billion on $20 trillion base) in year 1, vs. 3%, reflecting a full-blown crisis (e.g., Goldman Sachs’ recession odds at 90%+ post-selloff).
-
Capital Gains Drop: 60% reduction ($100B to $40B), vs. 50%, as markets freeze and realizations plummet.
-
U.S. Share: 50% ($20B) initially, with global panic hitting all assets.
-
-
Tariff Revenue Slash:
-
Cut to $120 billion/year, vs. $150B, due to intense retaliation (e.g., China’s 34%+ counter-tariffs, EU escalating to 25%, April 2025 reports) and a recession-driven import collapse.
-
-
Dynamic Recovery (Years 2-10):
-
GDP: Rebounds to 0.25% growth ($50B/year) in year 2, reaching 0.75% ($150B/year) by year 5, vs. 1%, as tariff benefits struggle against global headwinds.
-
Investment Shift: 60% foreign-to-U.S. shift ($30B over 5 years, $6B/year) starts year 2; new U.S. gains hit $10B/year by year 3, vs. $15B, reflecting a sluggish rebound.
-
Holding Shift: 5% (2 yrs), 5% (4 yrs), 10% (7 yrs), 80% (12 yrs) by year 5, unchanged but with lower volume.
-
Elasticity: 15% U.S. gains boost ($3B on $20B in year 1, rising post-recession), vs. 20%, muted by persistent uncertainty.
-
Revised Revenue Calculation
Year 1 (Extreme Recession)
-
Adjusted Gains: $40B ($20B foreign, $20B U.S.).
-
Revenue:
-
Foreign: $20B × 18.8% = $3.76B.
-
U.S. (25% each tier):
-
$5B × 7.5% = $0.375B.
-
$5B × 5% = $0.25B.
-
$5B × 2.5% = $0.125B.
-
$5B × 0% = $0.
-
-
Total U.S.: $0.75B.
-
GDP Feedback: -$800B × 20% × 25% = -$40B (revenue loss).
-
Tariffs: $120B.
-
-
Total Revenue: $3.76B + $0.75B – $40B + $120B = $84.51 billion.
-
Baseline (Current Law): $40B × 21.3% = $8.52B.
-
Revised Impact: $8.52B – $84.51B = +$75.99 billion surplus.
-
Adjusted Gains: $85B ($40B foreign, $45B U.S. with $12B shift + $3B new/elasticity).
-
U.S. Split: 10% ($4.5B) at 7.5%, 10% ($4.5B) at 5%, 20% ($9B) at 2.5%, 60% ($27B) at 0%.
-
Revenue:
-
Foreign: $40B × 18.8% = $7.52B.
-
U.S.:
-
$4.5B × 7.5% = $0.3375B.
-
$4.5B × 5% = $0.225B.
-
$9B × 2.5% = $0.225B.
-
$27B × 0% = $0.
-
-
Total U.S.: $0.7875B.
-
GDP Feedback: $50B × 20% × 25% = $2.5B.
-
Tariffs: $120B.
-
-
Total Revenue: $7.52B + $0.7875B + $2.5B + $120B = $130.8075 billion.
-
Baseline: $85B × 21.3% = $18.105B.
-
Revised Impact: $18.105B – $130.8075B = +$112.7025 billion surplus.
-
Adjusted Gains: $90B ($35B foreign, $55B U.S. with $15B shift + $10B new).
-
U.S. Split: 5% ($2.75B) at 7.5%, 5% ($2.75B) at 5%, 10% ($5.5B) at 2.5%, 80% ($44B) at 0%.
-
Revenue:
-
Foreign: $35B × 18.8% = $6.58B.
-
U.S.:
-
$2.75B × 7.5% = $0.20625B.
-
$2.75B × 5% = $0.1375B.
-
$5.5B × 2.5% = $0.1375B.
-
$44B × 0% = $0.
-
-
Total U.S.: $0.48125B.
-
GDP Feedback: $150B × 20% × 25% = $7.5B.
-
Tariffs: $120B.
-
-
Total Revenue: $6.58B + $0.48125B + $7.5B + $120B = $134.56125 billion.
-
Baseline: $90B × 21.3% = $19.17B.
-
Revised Impact: +$115.39125 billion surplus.
-
Year 1: +$75.99B.
-
Years 2-5: ~$113B/year (rising to $115.39125B).
-
Years 6-10: ~$117B/year (0.75% GDP sustained).
-
Average: ~$113 billion/year surplus.
-
10-Year Total: $1.13 trillion surplus.
-
Extreme Recession: Year 1’s 4% GDP drop and 60% gains collapse slash revenue by ~$69B vs. the prior $154.985B surplus, but $120B tariffs keep a $75.99B surplus-barely positive under brutal conditions.
-
Anemic Recovery: 0.25%-0.75% GDP growth and muted investment ($10B vs. $15B new gains) cap rebound, stabilizing at $115B-$117B surpluses by year 5.
-
Tariff Strain: $120B reflects heavy trade war losses (e.g., $80B-$100B eroded), yet still offsets the $10B static loss.
-
PAYGO: $1.13T surplus persists, but $310B less than the $1.44T prior case and $940B below the $2.07T ultimate test, showing significant vulnerability.
-
Static: $10.025B/year loss.
-
Prior Reality Check ($150B tariffs, 1% GDP, 3% recession): $144B/year surplus.
-
Harsher Test ($120B tariffs, 0.75% GDP, 4% recession): $113B/year surplus-21.5% lower, a $31B/year hit.
-
Recession Limit: A 5% GDP drop or 70% gains fall could push year 1 surplus below $50B, nearing breakeven.
-
Tariff Collapse: $120B assumes severe but manageable retaliation; a drop to $100B (e.g., total trade war breakdown) might cut surplus to ~$90B/year.
-
Growth Floor: 0.75% by year 5 is below OECD’s 2.2% baseline minus ~1.5% trade drag-realistic but assumes tariffs barely offset recession damage long-term.
A More Severe Recession with a V-shaped Recovery
Let’s rerun the dynamic scoring of the proposed capital gains tax structure with the harsher reality check ($120B tariffs, 4% recession in 2025) and a very sharp V-shaped recovery, proving Trump’s tariff vision correct over the long term. We’ll maintain the severe short-term shock from the market selloff (post-Trump’s April 2, 2025, tariff announcement) followed by a rapid rebound driven by tariffs, recalculating the fiscal impact over 10 years.
Proposed Capital Gains Structure Recap
Foreign/Non-qualifying: 15% (> $75,000); NIIT 3.8% (> $200,000).
-
Domestic U.S.:
-
7.5% (1-3 years), 5% (3-5 years), 2.5% (5-10 years), 0% (10+ years).
-
NIIT: 0% for U.S. gains.
-
-
Static Loss: $10.025 billion/year on $100 billion gains.
Adjusted V-Shaped Recovery Assumptions
Starting from the harsher test:
-
Extreme Recession (2025):
-
GDP Contraction: 4% decline (-$800 billion on $20 trillion base) in year 1.
-
Capital Gains Drop: 60% reduction ($100B to $40B).
-
U.S. Share: 50% ($20B) initially.
-
-
Tariff Revenue:
-
$120 billion/year, reflecting trade war drag but sustained long-term yield as Trump’s leverage prevails.
-
-
Sharp V-Shaped Recovery (Years 2-10):
-
GDP: Rebounds to 2% growth ($400B/year) in year 2 (vs. 0.25%), reaching 2.5% ($500B/year) by year 3, stabilizing at 2% ($400B/year) by year 5.
-
Investment Shift: 60% foreign-to-U.S. shift ($30B over 5 years, $6B/year) starts year 2; new U.S. gains surge to $25B/year by year 2, hitting $30B by year 3.
-
Holding Shift: 5% (2 yrs), 5% (4 yrs), 10% (7 yrs), 80% (12 yrs) by year 3, accelerated by tariff-driven confidence.
-
Elasticity: 30% U.S. gains boost ($6B on $20B in year 1, rising to $15B by year 2), as low rates and tariffs ignite realizations.
-
Revised Revenue Calculation
Year 1 (Extreme Recession)
-
Adjusted Gains: $40B ($20B foreign, $20B U.S.).
-
Revenue:
-
Foreign: $20B × 18.8% = $3.76B.
-
U.S. (25% each tier):
-
$5B × 7.5% = $0.375B.
-
$5B × 5% = $0.25B.
-
$5B × 2.5% = $0.125B.
-
$5B × 0% = $0.
-
-
Total U.S.: $0.75B.
-
GDP Feedback: -$800B × 20% × 25% = -$40B.
-
Tariffs: $120B.
-
-
Total Revenue: $3.76B + $0.75B – $40B + $120B = $84.51 billion.
-
Baseline: $40B × 21.3% = $8.52B.
-
Revised Impact: $8.52B – $84.51B = +$75.99 billion surplus.
-
Adjusted Gains: $105B ($35B foreign, $70B U.S. with $6B shift + $25B new + $9B elasticity).
-
U.S. Split: 10% ($7B) at 7.5%, 10% ($7B) at 5%, 20% ($14B) at 2.5%, 60% ($42B) at 0%.
-
Revenue:
-
Foreign: $35B × 18.8% = $6.58B.
-
U.S.:
-
$7B × 7.5% = $0.525B.
-
$7B × 5% = $0.35B.
-
$14B × 2.5% = $0.35B.
-
$42B × 0% = $0.
-
-
Total U.S.: $1.225B.
-
GDP Feedback: $400B × 20% × 25% = $20B.
-
Tariffs: $120B.
-
-
Total Revenue: $6.58B + $1.225B + $20B + $120B = $147.805 billion.
-
Baseline: $105B × 21.3% = $22.365B.
-
Revised Impact: $22.365B – $147.805B = +$125.44 billion surplus.
-
Adjusted Gains: $120B ($30B foreign, $90B U.S. with $12B shift + $30B new + $18B elasticity).
-
U.S. Split: 5% ($4.5B) at 7.5%, 5% ($4.5B) at 5%, 10% ($9B) at 2.5%, 80% ($72B) at 0%.
-
Revenue:
-
Foreign: $30B × 18.8% = $5.64B.
-
U.S.:
-
$4.5B × 7.5% = $0.3375B.
-
$4.5B × 5% = $0.225B.
-
$9B × 2.5% = $0.225B.
-
$72B × 0% = $0.
-
-
Total U.S.: $0.7875B.
-
GDP Feedback: $500B × 20% × 25% = $25B.
-
Tariffs: $120B.
-
-
Total Revenue: $5.64B + $0.7875B + $25B + $120B = $151.4275 billion.
-
Baseline: $120B × 21.3% = $25.56B.
-
Revised Impact: $25.56B – $151.4275B = +$125.8675 billion surplus.
-
Adjusted Gains: $125B ($25B foreign, $100B U.S. with $15B shift + $30B new + $20B elasticity).
-
U.S. Split: As above, scaled to $100B (U.S. revenue ~$0.875B).
-
Revenue:
-
Foreign: $25B × 18.8% = $4.7B.
-
U.S.: $0.875B.
-
GDP Feedback: $400B × 20% × 25% = $20B.
-
Tariffs: $120B.
-
-
Total Revenue: $4.7B + $0.875B + $20B + $120B = $145.575 billion.
-
Baseline: $125B × 21.3% = $26.625B.
-
Revised Impact: $26.625B – $145.575B = +$118.95 billion surplus.
-
Year 1: +$75.99B.
-
Years 2-3: ~$125.65B/year (averaging $125.44B and $125.8675B).
-
Years 4-10: ~$120B/year (stabilizing near $118.95B at 2% GDP).
-
Average: ~$119 billion/year surplus.
-
10-Year Total: $1.19 trillion surplus.
-
Severe Recession: Year 1’s 4% GDP drop and 60% gains collapse yield a $75.99B surplus, holding firm as $120B tariffs mitigate the crash.
-
V-Shaped Recovery: Year 2’s 2% GDP surge and $70B U.S. gains catapult surplus to $125.44B, peaking at $125.8675B in year 3 with 2.5% growth, proving Trump’s tariff-driven resurgence.
-
Long-Term Triumph: By year 5, $100B U.S. gains and 2% GDP stabilize at a $118.95B surplus, validating Trump’s vision of prosperity after a brutal start.
-
PAYGO: $1.19T surplus supports major policies, $60B above the prior harsher test’s $1.13T, reflecting the V-shape’s long-term boost.
-
Static: $10.025B/year loss.
-
Harsher Test ($120B tariffs, 0.75% GDP, 4% recession): $113B/year surplus (slow recovery).
-
V-Shaped Recovery ($120B tariffs, 2% GDP, 4% recession): $119B/year surplus-5.3% higher, a $6B/year gain from rapid rebound.
-
Recovery Pace: 2% GDP in year 2 assumes an extraordinary tariff uptake-e.g., manufacturing back online within a year-bold even for a V-shape (OECD’s 2.2% baseline suggests ~1.5% max without tariffs).
-
Tariff Stability: $120B persists despite recession; a drop to $100B could cut surplus to ~$100B/year, softening the V’s peak.
-
Investor Confidence: 80% at 0% by year 3 hinges on unwavering faith in tariffs post-crash-any wobble could delay this, blunting the V-shape.
Concluding Summary of Capital Gains Tax Scenarios and Analyses
The extensive modeling of the proposed capital gains tax structure-featuring a flat 15% rate for foreign/non-qualifying gains and tiered rates for qualifying U.S. domestic stocks (7.5% for 1-3 years, 5% for 3-5 years, 2.5% for 5-10 years, and 0% for 10+ years, with no NIIT)-reveals a wide range of fiscal outcomes under varying economic conditions and assumptions about Trump’s tariff policies. Starting from a static revenue loss of $10.025 billion annually on a $100 billion gains baseline, the analyses evolved through static scoring, dynamic scoring with optimistic tariff-driven growth, and progressively harsher recessionary tests, culminating in a V-shaped recovery scenario. Here’s a synthesis of the findings:
Static Baseline
Under PAYGO and CBO static scoring rules, the policy incurs a consistent $10.025 billion annual revenue loss ($100.25 billion over 10 years), reflecting pure rate reductions without behavioral or economic feedback. This establishes the starting point, assuming no shift in investment or growth-a conservative benchmark that tariff optimism seeks to overturn.
Dynamic Scoring with Tariff Optimism
Assuming Trump’s tariff claims hold-driving domestic investment and prosperity-dynamic scoring transforms the picture:
-
Initial Dynamic ($50B tariffs, 0.3% GDP): Reduces the loss to $7.5 billion/year ($75B/10 years), with modest investment shifts and GDP feedback offsetting ~25% of the static cost.
-
Ultimate Stress Test ($200B tariffs, 2% GDP): Yields a $207 billion annual surplus ($2.07 trillion/10 years), as massive tariff revenue, a $55 billion U.S. gains surge, and $20 billion in GDP-related taxes turn a loss into a fiscal windfall, fully validating Trump’s vision at its boldest.
Recessionary Reality Checks
Introducing the April 2025 market selloff and recessionary pressures tests resilience:
-
Moderate Recession ($180B tariffs, 1.5% GDP, 2% drop): A $177 billion/year surplus ($1.77 trillion/10 years), with a $56 billion year 1 hit recovering to $178 billion by year 5, showing tariffs ($180B) cushioning the blow.
-
Harsher Recession ($150B tariffs, 1% GDP, 3% drop): $144 billion/year ($1.44 trillion/10 years), with year 1 at $114.99 billion, reflecting deeper losses but a tariff-driven rebound.
-
Extreme Recession ($120B tariffs, 0.75% GDP, 4% drop): $113 billion/year ($1.13 trillion/10 years), with year 1 at $75.99 billion, barely positive under severe stress, highlighting tariff dependency.
V-Shaped Recovery
The final scenario-4% recession, $120B tariffs, with a sharp V-shaped recovery to 2% GDP by year 2-delivers a $119 billion annual surplus ($1.19 trillion/10 years):
-
Year 1: $75.99 billion surplus, battered by a $40 billion gains base and $40 billion GDP revenue loss, yet buoyed by $120 billion in tariffs.
-
Years 2-3: Surges to $125.44 billion and peaks at $125.8675 billion, with $70B-$90B U.S. gains and $20B-$25B GDP feedback, proving Trump’s rapid recovery claim.
-
Year 5 Onward: Stabilizes at ~$120 billion/year, with $100B U.S. gains and 2% GDP, affirming long-term prosperity despite the initial plunge.
-
Tariff Dominance: Across all scenarios, tariff revenue ($120B-$200B) is the linchpin, flipping static losses into surpluses. Even at $120 billion with a 4% recession, it offsets the $10 billion static hit, underscoring Trump’s leverage assumption.
-
Recession Resilience: A deep 4% GDP drop and 60% gains collapse in year 1 never erase the surplus, with $75.99 billion holding as the floor-tariffs and low U.S. rates provide a buffer.
-
V-Shaped Validation: The sharp rebound to 2%-2.5% GDP and $100B U.S. gains by year 5 in the final scenario proves Trump’s vision if recovery is swift, though it hinges on aggressive tariff uptake and investor confidence (80% at 0% by year 3).
-
Fiscal Range: Outcomes span a $100.25 billion static loss to a $2.07 trillion surplus, with the V-shaped $1.19 trillion landing mid-tier-realistic yet optimistic, balancing short-term pain with long-term gain.
-
Policy Viability: A $1.19 trillion surplus funds major initiatives (e.g., TCJA extension), but $880 billion below the ultimate $2.07 trillion shows recessionary costs tempering the upside.
-
Risks: A slower recovery (e.g., 0.75% GDP) or tariff erosion to $100 billion could drop surpluses to ~$100 billion/year, while a 5% recession might push year 1 near breakeven.
-
Economic Plausibility: The V-shape’s 2% GDP in year 2 exceeds typical post-recession rebounds (OECD’s 2.2% baseline suggests ~1.5% max without tariffs), requiring near-perfect tariff execution and global acquiescence.
Conclusion
The proposed capital gains structure, paired with Trump’s tariff strategy, ranges from a modest revenue loss to a transformative surplus, with the V-shaped recovery scenario ($1.19 trillion) offering a compelling narrative: a brutal 2025 recession overcome by a tariff-fueled boom, proving Trump correct over the long term if economic stars align. The policy’s success rests on tariff revenue holding above $120 billion and a recovery surpassing historical norms-achievable under Trump’s optimistic vision, but fragile if trade wars or market doubts persist.
